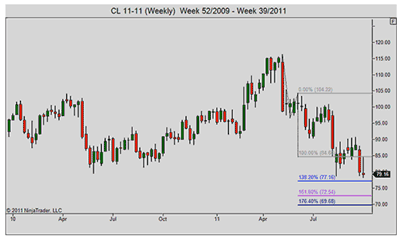
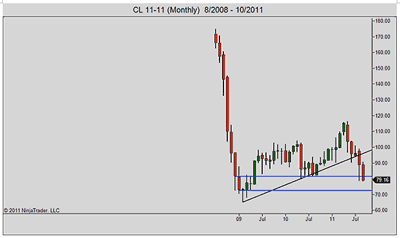
With oil futures prices retreating towards a trio of Fibonacci retracement levels, it’s likely that we’ll have a re-test of lower levels last seen as far back as 2009.
From the start of 2011 through the present, crude oil futures have been as roiled, wild, and volatile as any commodity market could be. Considering oil gets treated as a consumer product and a quasi-currency alike, it's been a year's worth of global unrest in the political and financial arenas.
The weekly price chart above shows the most recent 1-2-3 lower swing from early-2011 highs projects price magnets at 77+, 72+ and 70 price zones for crude oil futures.
The 85 level served as lower zone congestion from mid-2010 through September 2011. Now that it has clearly given way, any further tests of that zone are presumed to be resistance until proven otherwise.
The monthly chart view (above) of crude oil futures shows price action magnetized near a long-term pivotal zone dating back through late 2008 to early 2009. If this level fails to contain selling, the 72-73 level from the early-2009 era will be revisited.
The fate of crude oil rests in dual hands: supply/demand from end use as a commodity and dollar-value gyrations as a quasi-world currency of sorts. With world economies rocked and US dollar values ascending, downward is the trend of friends in crude oil futures for now.
By Austin Passamonte of CoiledMarkets.com
Austin Passamonte is a private trader who trades E-mini stock index futures intraday.


