
Recent action in the futures markets provides a useful backdrop for studying how to identify and trade intraday trend reversals using multiple time frames to confirm signals on the charts.
Last week gave us back-to-back examples of one of my favorite patterns and trade set-ups: the intraday trend reversal on clear positive dual divergences.
We’ll be using the e-Mini S&P futures as our proxy, but this example extends to any index futures contract or related ETF (including the leveraged funds).
Let’s take a moment to learn about this concept and see clear reference examples from October 20 and 21.
Click to Enlarge
Here’s what we’ll emphasize in this article:
- Positive divergence in momentum (using the 3/10 oscillator)
- Positive divergence in NYSE TICK (market internal)
- Confirming reversal candles
- Price confirmation via trend line and EMA breakthroughs
- “Stepping inside” the structure using the one-minute chart
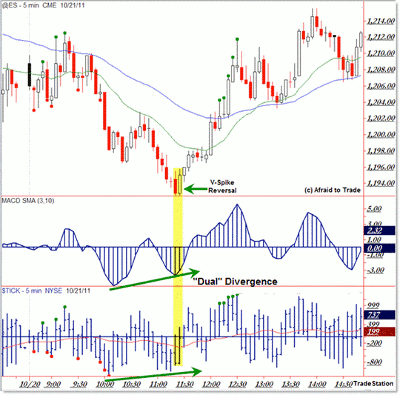
Trends (on any time frame) often end with divergences, and in this case we’ll be discussing a very short-term intraday trend using the five-minute chart.
Using the 3/10 oscillator (middle panel) and the NYSE TICK (bottom panel), we see a higher indicator low going into 11:30 am while price pushed to new intraday lows on October 20.
See related: How to Use the NYSE TICK Indicator
We call this a “dual positive divergence” because both TICK and momentum diverge with the new price low.
Article Continues on Page 2
|pagebreak|From a candle standpoint, we see a bullish engulfing pattern, or as much as a five-minute bar can “engulf” another one with the power bar off 1,194.
You can see the resolution of a successful reversal into the session close, giving rise to a breakout trade (above 1,200) and a bull flag retracement trade at 1:30, but that’s for another post.
Click to Enlarge
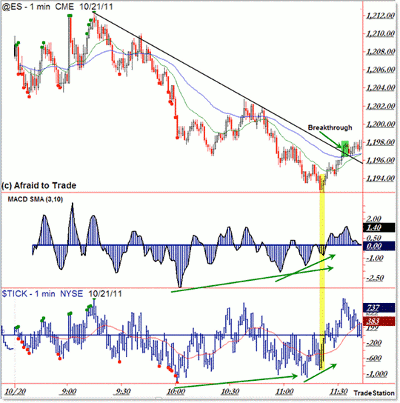
Let’s step inside the positive dual divergence action at 11:30 am to see exactly what the one-minute chart showed in real time:
Click to Enlarge
I froze the chart just after the confirmation breakthrough (a buy signal) so you can visualize what this looked like in real time. That is your goal in understanding and trading this concept.
We use the lower time frames to clarify, or “step inside” any situation or pattern we’re seeing on the higher frames, and in this case, the combination is the five-minute and one-minute frames.
See related: More Time Frames, More Confidence
Look closely to see the “inner workings” of the clean positive dual divergence into the 1,193 low just before 11:30 am.
It’s generally not advised to fight a trend on the sole basis of a positive divergence, but some aggressive traders do it.
Personally, I prefer to wait for price confirmation via a clean breakthrough of a falling clear trend line (as seen above) or through lower-time-frame exponential moving averages (EMAs) (we’re seeing the 20- and 50-period EMAs in all charts) before jumping in with a reversal trade.
The main idea of the lower frame chart is to see finer/clearer details that may not show up on higher-time-frame charts…and also to find the clearest buy signal via price confirmation.
Article Continues on Page 3
|pagebreak|Once you understand or see that price is likely forming an intraday reversal, you can trade accordingly, playing future breakouts or retracement trades in the context of the new intraday reversal.
At a minimum, do not short sell after clean positive divergences and breakthrough confirmation signals like the ones you see above.
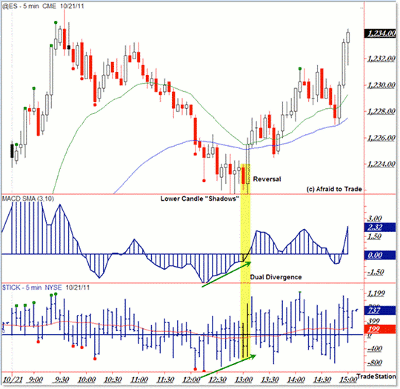
That’s the main lesson from this example, and to make it even clearer, let’s see the same five-minute and one-minute time frame charts of the very next day, October 21:
Click to Enlarge
Using the description above, we can see a similar five-minute positive dual divergence in momentum and TICK, this time going into 1:00 pm CST into the 1,220 level.
We see a similar—yet far more powerful—bullish engulfing reversal candle, but this time we have a series of bullish lower shadow candles ahead of the engulfing candle.
You can see the successful reversal that developed off this positive divergence situation.
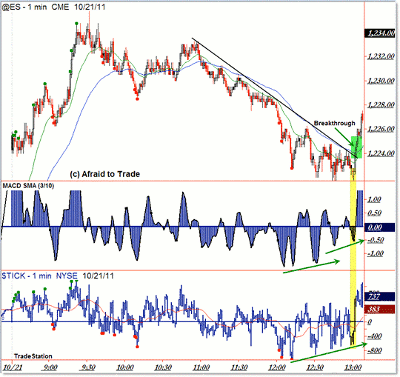
Let’s step inside the one-minute chart and freeze the session as it looked in real time as these divergences developed:
Click to Enlarge
The one-minute chart gives us a clearer picture with more detail than the five-minute chart in terms of spotting dual divergences in real time as they develop.
We also see the confirmation signal from price via the breakthrough of the 20/50 EMAs and the intraday trend line; the preferred buy-in spot for a reversal play.
This is the kind of in-depth trade analysis and lessons we discuss in each evening’s “Idealized Trades” report for my members.
It’s also the type of examples I’ll be explaining in much more detail at the upcoming Las Vegas Traders Expo in November, if you’re able to join us.
Take a moment to study these charts for additional insights and apply the lessons to your own trading strategies.
By Corey Rosenbloom, CTA, trader and blogger, AfraidToTrade.com


