By using specific simple moving averages on monthly charts, traders can receive helpful validation signals regarding long-term trends, particularly in metals like gold, copper, and others.
We characterize long-term super-trend analysis by plotting a nine-month simple moving average (SMA) against a 20-month SMA on a monthly bar chart.
The basic analysis examines the current market above or below both of these moving averages. This is an extension beyond basic moving average analytics, which focuses on the point in time when one average crosses the other.
A long-term super-trend uptrend is therefore defined as a trading environment when:
- The nine-month moving average has crossed over (above) the 20-month moving average;
- Both the nine- and 20-month moving averages are trending higher; and…
- The market is trading above the nine-month moving average
A long-term super-trend downtrend is therefore defined as a trading environment when:
- The nine-month moving average has crossed below (under) the 20-month moving average;
- Both the nine- and 20-month moving averages are trending lower; and…
- The market is trading below the nine-month moving average
Super-Trend Example in Copper Market
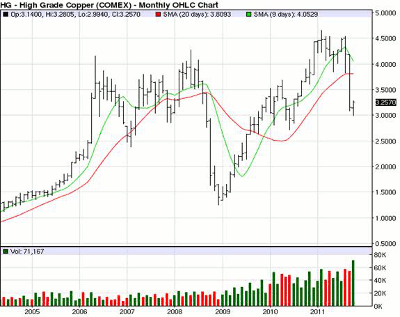
From 2004 up until November 2006, copper futures met the super-trend uptrend “test.” The averages were trending higher, the nine-month MA (green line) was above the 20-month MA (red line), and the market was trading over the nine-month average.
This super-trend uptrend, as we define it, ended in November 2006 and did not appear again until September 2010 (ending in May 2011).
But during the six-month period lasting from October through March 2009, copper met our definition of a super-trend downtrend.
NEXT: Is a Super-Trend Unfolding in Gold Right Now?
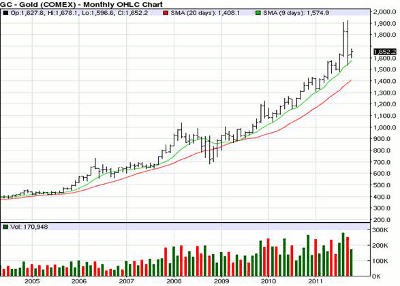
|pagebreak|It would appear on this chart below (dated October 7, 2011) that the gold market meets the test for defining a super-trend uptrend.
While past performance is not indicative or predictive of future results, the long-term history on the chart indicates that since April 2009, whenever gold has pulled back to the nine-month simple moving average (green line) since April 2009, it has held there and gone on to eventually make a new all-time record high.
Again, that does not mean it will happen again. The super-trend analysis is not intended as a trading tool, but in our opinion, can serve as a validation of fundamental and technical analysis for those who prefer to focus on a long-term outlook for this market.
By Larry Schneider of Zaner Group
No technical indicators work 100% of the time, including nine- and 20-period simple moving averages and super-trend analysis. Trading futures and options is speculative in nature and involves substantial risk of loss and is not suitable for all investors. You should carefully consider whether trading is suitable for you in light of your circumstances, knowledge, and financial resources. All known news and events have already been factored into the price of the underlying commodities discussed.


