The recent trend of equity and commodity markets essentially moving upwards in unison alongside bonds and the US dollar defies conventional reason, suggesting that "Something's gotta give," writes Corey Rosenbloom.
If you use intermarket or cross-market analysis in your trading or investment decisions, you've probably noticed something very strange over the last few months.
Let's take a look at what's "going wrong" from a classic intermarket perspective, which leads us to a "something's gotta give" situation in terms of a building reversal.
See related: What Intermarket Analysis Means to You
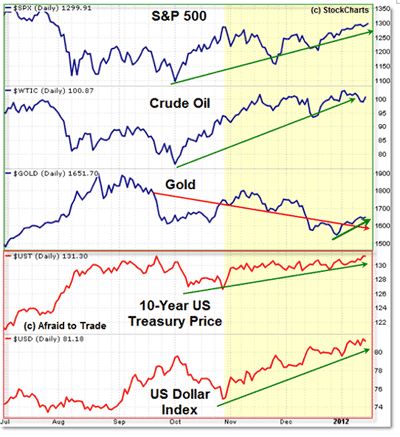
First, the closer perspective of five cross-market quick charts:
In terms of cross-market analysis, it's best to group the broad markets into four components: stocks/equities, bonds/treasuries, commodities, and currencies. This can be done in a number of ways using various index symbols or popular ETFs.
From this, you can view various trends and then break each market down into individual components for clearer trading opportunities.
But for this post, I want to focus on the difference between "risk-off," or defensive markets, such as US Treasuries (bonds) with the US dollar index and the "risk-on," or offensive markets, such as commodities (gold and crude oil) and, of course, stocks.
See related: "Risk-on" vs. "Risk-off" Trades
NEXT: Phenomenon Begs 2 Important Questions
|pagebreak|Risk-off (defensive) and risk-on (offensive) markets tend to move opposite each other in terms of their trends, but that's not what's happening currently, which warrants our attention.
In the line chart on page one, we saw all markets (except for gold) rising from the September/October lows to the current January highs.
In fact, these creeping uptrends leap off the charts at us, which begs these questions:
- Why are all markets rising and what does it mean?
- When will one or more of these markets reverse back to "normal?"
The answer is beyond the scope of this post, but it merits further attention.
From a quick price perspective, here are the current resistance levels to watch:
- S&P 500: 1,300
- Crude Oil: $103
- Gold: $1,700
- US 10-year Treasury Notes: 131
- US Dollar Index: 81.50
Would it be possible for all markets to break above their respective resistance levels? Yes, anything could happen, but that would be the lower-probability (and some would say "very unlikely") outcome.
The classical thinking would be that either the risk-on markets fail to overcome resistance and reverse lower, boosting risk-off assets above their resistance, or vice versa (risk-off markets boost higher, reversing risk-on markets).
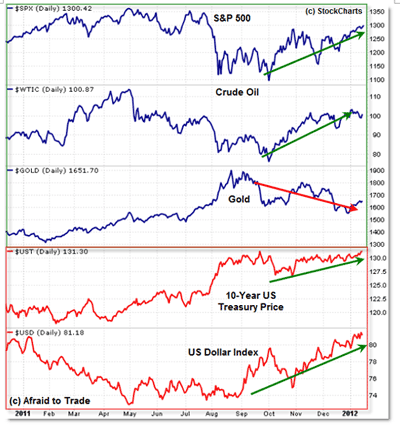
Here's a longer-perspective cross-market line chart from 2011 to present:
Watch these markets, as well as larger perspectives and time frames, in the context of classical "risk-on" and "risk-off" parameters.
Mark Douglas in his popular book, Trading in the Zone, reminds us that "Anything can happen" in the markets, but given the critical resistance levels and creeper (divergent) rallies into respective resistance, one has to assume that "Something's gotta give" (or reverse) soon.
By Corey Rosenbloom, CMT, trader and blogger, AfraidToTrade.com
Corey will be speaking on this topic and others at the upcoming New York Traders Expo


