The bullish daily chart picture for Amazon.com (AMZN) is in stark contrast to the weekly chart, which is bearish and conflicting, thus serving to validate the importance of multiple time frame analysis.
Amazon.com’s (AMZN) chart structure is creating an interesting breaking point of tension between the higher and lower time frames.
While the daily chart argues for a potential reversal higher, the weekly chart shows a barrier of overhead resistance that must be broken before a reversal higher can take place.
It’s a good example of how to incorporate two time frames in real-time, so let’s take a look at AMZN:
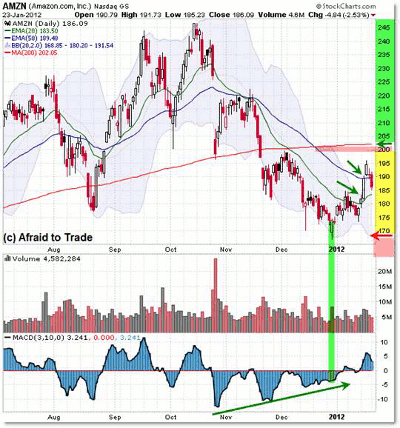
Keeping the description focused on combining two time frames, the daily chart shows the odds hinting at a possible upward bullish reversal.
This structure is due to a lengthy positive momentum divergence and the bullish reversal candle off $170 in late December.
Price then broke above both the falling 20- and 50-day exponential moving averages (EMAs) (green arrows), yet fell shy of testing the 200-day simple moving average (SMA) and round-number resistance at $200 per share.
In simple terms, Amazon would be seen as a buy for a potential reversal on a firm breakthrough above $200. Initial targets would include $220 and higher in the context of “open air” above $200.
But not so fast! Before we get excited from the bullish side, let’s look at a barrier overhead via the weekly chart.
NEXT: Weekly Chart Paints Much Different Picture
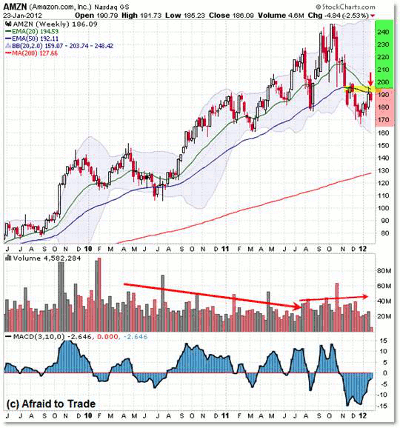
|pagebreak|The weekly chart suggests a different picture – or at least that we need to put the potential daily chart reversal in a larger context.
(This is the type of discussion we’ll have in my upcoming live Webinar on “Two-Time-Frame Trading Tactics” with Mirus Futures on January 31. One of the topics will be how to put smaller time frames in the context of larger-time-frame levels or key points that you might otherwise miss on the lower frames.)
Amazon gives us a good real-time example of this topic.
While the daily chart lays the foundation for a potential bullish reversal and break higher, the weekly chart makes the $195-$200 level all the more important in terms of structure and trading expectations.
That’s because we see a breakdown in structure (trend) and both the 20- and 50-period EMAs (indicator structure) on the weekly chart, which gives us a confluence resistance barrier from $195- $200.
Due to the confluence resistance (and seemingly bearish tone of the weekly chart), it makes any actual (real-time) break firmly above $200 all the more important in terms of a reversal of trend and structure to the bullish side.
Yet in the absence of any firm break above $200, we’ll be looking for the bigger picture’s bearish structure to weigh down (or invalidate) any lower time frame early reversal signs we’re seeing.
Summing up as simple as possible, from an objective gameplan and trading standpoint, AMZN becomes very bullish structurally above $200; cautious to bearish under $200; and bearish for a higher-time-frame breakdown under the recent $170 swing low.
These can be used to develop short-term strategies as price trades around—or breaks through—these levels.
See also: Spotting a Good Trade on Multiple Time Frames
By Corey Rosenbloom, CMT, trader and blogger, AfraidToTrade.com


