
Proper price and volume analysis is all that is required to identify and execute profitable trades in the E-mini futures and a range of other markets, writes Dr. Gary Dayton, dissecting two past trade examples.
Accumulation, or the buying of stock or futures contracts in a given range in anticipation of higher prices, is a valuable pattern for traders to learn. Intelligent reading of the price bars and volume is all that is needed to identify these profitable patterns. We will look at two examples of accumulation from the S&P E-mini market.
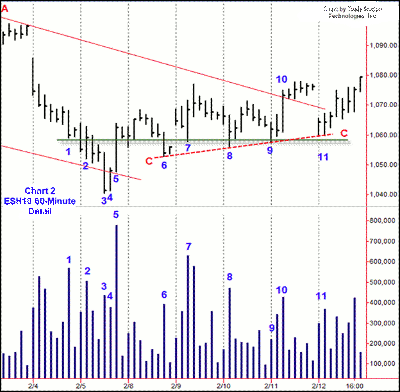
60-Minute Chart
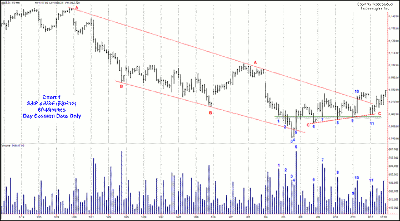
The S&P E-mini had reacted into early February from its highs in January 2010. The reaction was well-defined on the hourly chart (chart 1, below) by the trend lines AA and BB, which together formed a channel. Line AA was drawn off rally peaks and Line BB from the low points.
Click to Enlarge
Click to Enlarge
On a typical market day in the S&P E-minis, volume is heaviest in the first 90 minutes of the day and again in the last 60-90 minutes. Volume is usually light in between these periods, with the lightest volume occurring during the noon-hour period (New York time). A typical day in volume will often look U-shaped.
It was noteworthy, therefore, when high volume entered mid-day on bars 3, 4, and 5 (on Chart 2). It signified that market behavior was changing. Bars 4 and 5 reflected a significant rally on sustained, high volume—something not seen before in this downdraft.
Bar 5 is the largest up bar on the largest volume since the downtrend had begun. This is usually significant and a useful “market tell,” denoting the end of a down move. In this case, the market rejected lower, oversold prices and then rallies strongly—this is bullish behavior.
The next day (February 8), the market pulls back on Bar 6, reaching a low of 1053. Although price did not fall hard after breaking the early-morning low on this day, sellers did close the day on its lows, indicating supply remained present. At this point, it is unclear whether the market would fall lower the next day.
Daily Highs and Lows
On February 9, we have a small gap opening and a brief rally into the prior day’s high. In trading the S&Ps, the prior day’s high and low are often key reference levels of support or resistance.
A daily chart of the S&Ps will show that there is often active trading around these levels. Good daytrades often set up at the prior day’s high or low. After testing yesterday’s high, the market fell back about ten points towards the prior day’s low.
That low did not get breached, however. Buyers came in strongly and drove the market back up to a new high on the day. This is bar 7. Note the strong close, wide range, and the high volume. Demand came into the market.
Accumulation
The next day (February 10), the market drops lower at bar 8, but again, we see buying come in at about the same level as on bars 6 and 7. The low at bar 6 was 1053.00; the low at bar 7 was 1058.00. Bar 8 dipped to 1056.25 before reversing. The close of this bar is in the middle; the market then rallies. Volume is high. Buyers stepped in.
The next morning (February 12), the market again drops into the same zone where buyers were present at bars 6, 7, and 8. Volume on bar 9 was comparatively light as it dipped into the buying zone. The market rallies strongly and breaks the trend line AA on bar 10.
We now look closer at the market and make some useful conclusions. We can go back in time and see that high volume came in on bars 1 and 2 at the same level of buying that we have seen since the lows at bar 3 had been put in. This level is highlighted with a green line. It is likely that buying—partially under the cover of the drive down to the February 5th lows—had been occurring as early as February 4 and continued throughout the following week.
We can also see that the lows had been lifting along the red, dashed line CC. Buyers became increasingly aggressive (with supply decreasing) as the trading range progressed. On the last day, the market gapped below line AA, but held the rising line CC at 11 and rallied back out of the downtrend channel, closing on its high and decisively breaking the downtrend.
NEXT: Value of Price and Volume—Swing Trade
|pagebreak|Value of Price and Volume—Swing Trade
It is worthwhile to note that many trading blogs and commentaries were calling for “a new leg down” at the time. Traders skilled at reading price and volume would at least be skeptical of such calls. In developing chart reading skills, traders place themselves in a position of independence, without having to rely on others or on frequently bewildering indicators.
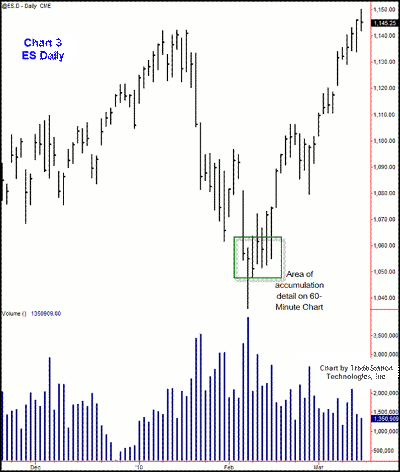
The implications for a swing trader are obvious. There was evidence of sufficient buying for a good swing trade to the long side. This was accumulation in action. Once buyers have stepped into the market and repeatedly bought over several days like this, the odds favor that “a new leg up” is in the offing. Chart 3 shows the subsequent mark-up.
Click to Enlarge
A recent sharp reaction in the S&P E-mini market left many traders thinking lower prices were inevitable. Those who could read the accumulation taking place, however, were prepared to go long when the market later tipped its hand with a Wyckoff Spring.
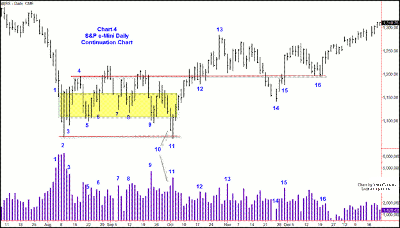
On Chart 4 below, we see the market falling on heavy volume into the first week of August 2011. The downdraft is characterized by wide range price bars closing on their lows. Volume increases and by bar 1, becomes very heavy. In fact, this bar’s five million contracts was the largest volume since the flash crash selloff of May 6, 2010, sixteen months earlier. Very active liquidation was taking place.
Click to Enlarge
Change of Behavior
Note carefully the action and characteristics of bar 2. It fell underneath the low of the prior day, then reverses and rallies strongly to close on its highs. All of the selling of the previous day is overcome on the largest up bar since the down move began.
This, together with the strong buying action and large volume denotes a change of behavior in the market. As in the 60-minute chart, we see strong buying coming into the market for the first time in the downtrend—a potential mark of the end of the reaction.
On the bar following 2, sellers attempt to resume the downtrend, but bar 3 shows buyers quickly reasserting control. Again we see price bar 3 dip underneath the previous bar, reject lower prices, and buying dominate the day with the bar closing firm, erasing the selling of the previous bar.
As the market rallies up to 4, we notice two important characteristics that signal a lack of buying on the up move: the ranges become smaller and the volume diminishes. Buyers have either exhausted themselves or are unwilling to chase prices higher. Either way, the market is poised to fall back in a reaction.
Selling Climax
How the market reacts gives important insight. The reaction will either confirm or disconfirm that the buying seen on 2 and 3 will hold and that we have seen a selling climax.
A selling climax marks the end of a downtrend. It reflects a capitulation of investors and traders panicked by the declining state of the market. They sell their holdings in fear of further price declines. This liquidation is matched by others who recognize the emotional selling and perceive prices to be attractive. They buy. Often, these buyers are large interests and trading firms who fully understand the opportunity before them. This is why we see wide ranges and very heavy volume (representing abnormal levels of market activity) coming at the end of a decline.
If the selling is over, the reaction will hold at or above the area of panicked selling and active buying seen during the climax.
The reaction down to 5 shows confirmation of the selling climax. Note the lower volume compared to the volume level at 2 and 3. Also consider the ranges of the bars. On the reaction down from 4, the ranges become smaller. In contrast to the wide ranges at the climax showing large activity, the ranges at 4 testify that the trading activity has diminished. All the panicky selling seen earlier has dried up.
NEXT: Spotting Evidence of Accumlation
|pagebreak|Evidence of Accumulation
On the rally up, we see that a dip down at 6 is quickly reversed by buyers. Price had fallen below the lows of the prior two days, but buyers stepped in and aggressively pushed price back up through those lows. Some selling came in on the bar prior to 6, and sellers apparently tried to press their advantage the next day. Demand, however, overcame this supply and the day closed firm.When the market falls back down to 7 and 8, we again see that buyers step in. Note that this buying occurs in the same area as 6. Also note that the ranges—although not ultra wide—are robust, the volume picks up, and closes are firm. As the market falls, sellers unload holdings fearing further decline and buyers eagerly snap them up.
After bar 8, the market rallies back up near the highs of the trading range first established at 4. In this area, we again see the ranges narrow and the volume recede. As seen earlier, such behavior indicates that the market is not ready to rally through the trading range highs. Without sufficient demand, it naturally falls back.
At bar 9, buyers once again enter the market. Bar 9 is slightly different in character than bars 6, 7, or 8. On 9, we see the market close in its lower half, but this is actually not a poor close. The bar closes off its lows with a sudden increase in volume. Buyers stepped in during the afternoon and bought into the close. If the large increase in volume was dominated by selling, the market would have fallen further and closed on its lows.
The next day confirms the late-day buying on bar 9 as a small dip under the low brings out no further selling and the bar closes firm with upside follow-through the next day.
We can now clearly see that after five pushes down (at 5, 6, 7, 8, and 9) into the same price area (from approximately 1100 to 1125), the market held that level and rebounded each time. This is the hallmark characteristic of accumulation we had seen above on the 60-minute chart; here it is on the daily time period. It indicates active and strong buying. Each time the market falls to this level, buyers stop the market from going lower. The market is being accumulated in anticipation of higher prices.
Wyckoff Spring
On the final push down, a test is made of the extreme high volume and selling activity at the climax area of bar 2. Bar 10 drives down and closes on its low. A change from the previous bars highlighting the buying along the 1100 level, bar 10 tells us in advance that the market is likely to go lower.
The volume and also the range of bar 10, however, are not the same as we saw previously at the selling climax. Here, the range is smaller and the volume significantly lower. These subtle clues along with the background of buying tell us that the market is unlikely to go much lower.
On bar 11, the market dips down underneath the climax low at 2 and rallies aggressively back above the low on an increase in volume and a firm close. Most of the volume on this day came in on the rally as traders recognized that the climax lows of 2 were holding. This kind of market action is known as a spring, and is a choice long trade set-up when evidence of accumulation is clear throughout a trading range, as here.
Springs are favored by professional traders because they frequently ignite a swift market rally.
Rather than recede at the top of the rally as it did earlier, volume is sustained, showing buyers continue to buy. Bar 12 shows the market is unwilling to fall back from the top of the trading range. The dip below the previous two days brings out strong buying. We never saw this type of bullish action at previous highs. The mark-up continues to new highs at 13.
Test of the Accumulation Area
The market holds for several weeks above the previous trading range and then falls back into the range in late November. Usually, falling back into a trading range is a negative development for a market. But here, neither increased volume nor wide ranges develop as they did on the drive down to bar 2.
Note that the market returns one last time to the accumulation level highlighted in yellow. With supply drained from this area, the market rallies aggressively with bar 15 showing strength in the buying. The sudden high volume of bar 15 is tested at 16 as the market returns to the top of the trading range that had served as prior resistance and now is support. The market then advances with buyers in control.
Summary
We have reviewed two examples of accumulation leading to a mark-up in prices through the detailed reading of price bars and volume. We discussed the characteristics of climactic action, change in behavior, and the telltale level of support that emerges when a market is being bought under accumulation.
We have also discussed testing and the Wyckoff Spring, along with many elements of reading a market by its own action in a bar-by-bar fashion.
Traders who have learned the skills covered in this article can develop an independent view of the market—one based on the characteristics of supply and demand, the true drivers of the market—as read through price bars and volume.
By Dr. Gary Dayton of TradingPsychologyEdge.com
Dr. Gary Dayton actively trades the S&P E-minis. He also teaches traders how to read the market on a bar-by-bar basis at his Web site.


