Robert Sinn analyzes the latest technical action in gold and defines key price levels and developments to watch, including the potential formation of a chart pattern that has been quite prevalent this year.
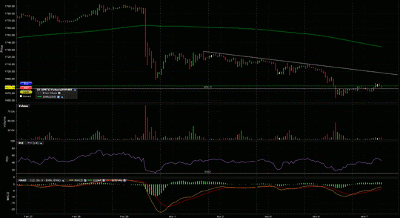
Yesterday, as anticipated, gold breached its 200-day simple moving average (SMA) before managing to claw back above this line by the market close. The early-week plunge below the $1670 level had many characteristics of a capitulation “selling exhaustion,” as some trend-following holdout longs sold on the break below this widely noted dynamic line.
A significant RSI (on the hourly time frame) and volume divergence between yesterday’s low and last Wednesday’s plunge low at $1688.40. Gold was still wrestling with the 200-day SMA, and bulls will want to see gold rise above the short-term downtrend line and the key $1700 level.
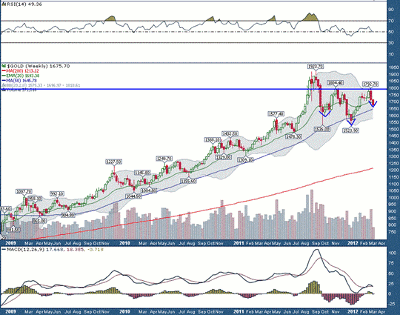
Should gold begin to stabilize and rise back above $1700, people will begin pointing to a potential inverse head-and-shoulders bottom on the weekly chart, which may eventually set the stage for another important test of resistance at $1800.
By Robert Sinn of RobertSinn.com


