
Look for a potential sideways or corrective phase to begin in the S&P 500, predicts the staff at Briefing.com, especially if a specific support level is unable to hold in the coming sessions.
If we take a look at the last few days of action in the markets, there’s been a series of "distribution days" which suggest the two-and-a-half-month uptrend off the December low is more than likely waning.
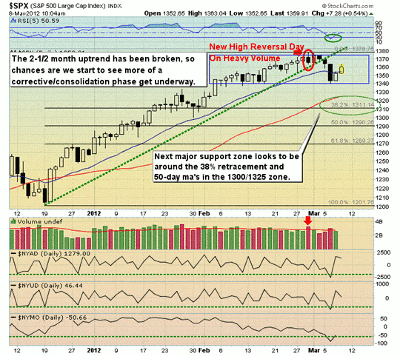
One of the key signals that we pointed out last week into February’s month-end was the new high reversal on heavy volume (Feb. 29). Such occurrences typically will thwart the current momentum for at least a week, as it did back in late-January (Jan. 26) as well.
The only difference this time around is that we did get some significant "follow through" lower, which managed to break the underlying uptrend lines and in some cases the rising 20-day exponential moving averages (EMAs).
The Nasdaq 100 was the only major index not to close under its 20-day EMA, but that’s more than likely due to its most heavily-weighted component, Apple (AAPL), masking the rest of the group’s weakness. (On the March 6 selloff, 69 of the 100 Nasdaq 100 stocks closed under their 20-period EMAs, while the index itself did not).
Recall too that the small- and mid-caps were noticeably lagging the large-caps’ trend higher in the latter half of February. We made reference to that being like a "General running into battle without his troops behind him."
Large-caps and heavily-weighted index components will often "hide" what’s going on underneath the surface. In most bull phases, you want to see the more "speculative" money flowing into small- to mid- cap names, not out of them. Hedging/shorting the iShares Russell 2000 Index Fund (IWM) or SPDR S&P Mid-Cap 400 ETF (MDY) a week ago against any swing long balances was prudent.
Moving on to the daily chart of the S&P 500 Index (SPX) below, we appear to be in "bounce mode" off Tuesday’s distribution, which took RSI-5 down to a low of 23, it’s lowest reading since the day after Thanksgiving.
We also see some other "extreme" oversold readings among the Advance/Decline line, Up/Down Volume, and the McClellan Oscillator. The SPX was also back near its mid-February support zone in the 1335/1340 area, so after three down days, a bounce was favored.
The question going forward is “Was this correction a mere blip to shake out some late longs before resuming higher, or was it the start of what could be more of a corrective/consolidation phase?”
Personally, I’m in the latter camp, thinking this market is due for some sideways/corrective action to "weed out" weaker groups/stocks among the true leaders. It seems like almost everything has gone up significantly since January began, and it’s now time to separate the "wheat from the chaff."
I do have my eye mainly on our liquid momentum focus list, which tracks the strongest-relative-strength performers for Briefing.com subscribers. I want to keep track of which stocks are shrugging off broader market down days and showing signs of consolidating or holding key uptrends and rising moving averages. Those not succumbing to distribution often will be the first to turn back up.
Take note that most corrective moves will typically come in an A-B-C pattern. That’s one leg down (A), a bounce (B), then another leg down (C). With that in mind, I think there is a good possibility that we see another dive lower towards the 50-day MAs or even the 38% retracement down in the 1300/1325 zone.
If last week’s current low of 1340 is taken out, there’s a good chance that’s what’s in store. Of course, I wouldn’t bet too heavily on that, as it’s also quite possible that those dip buyers would wind up squeezing the markets right back up to the highs.
Click to Enlarge
Bottom line, we’re favoring buying some weakness in leading names that drop back to key support, but also looking to hedge/short some index/sector ETFs as they rally into resistance.
By the Staff at Briefing.com


