
Ron Wagner from RevolutionaryTrading.com explains how he uses Advance/Decline (A/D) numbers in his long- and short-term trading.
Over 15 years ago, I had so many indicators on my charts I could hardly see the price and volume candles behind them. I have since found the more simple I keep things, the better my trading is.
Two of the few pieces of information I look at now are the advancers and decliners. I look at them each day in numerical form, which gives me a good read on general overall market sentiment.
I used to allow myself to be biased based on the numerical increase or decrease in the major market indexes, such as the S&P 500 (SPX) and Nasdaq (NDX). I have never allowed myself to be influenced much by the rise and fall of the Dow (DJIA), as that is only 30 stocks, even though it is a good representation of many sectors.
The SPX and NDX, although both contain more stocks than the DJIA, can still be heavily influenced by just a few stocks or sectors that are impacting the overall numbers. I would ask myself, years ago, why would many of my stocks be moving in the opposite direction of the market on certain days?
The answer was simple. It can be in part due to sector rotation, which I will discuss in another article, but is often because of either a flight to safety, or only a few very highly weighted stocks affecting the market.
The number of advancers versus the number of decliners viewed daily can really give you a good picture of the general market sentiment. Afterall, we want to trade in the path of least resistance and in the direction where the most people want to go.
Here is an example of two different days, and I know it will be very easy for you to see what is going on, even without knowing how much the markets were up or down on those days:
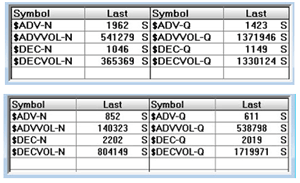
Click to Enlarge
The symbols with "-N" would be for the New York Stock Exchange and the "-Q" is for the Nasdaq. I keep an eye on these numbers each day and also use them for my short-term trading. Interpreting the volume relationships is a little trickier, and I will cover that in future material.
To help guide me even more for my short-term trades, I like looking at the advancers and decliners graphically. I have found this type of analysis to be extremely reliable. For me, the charts can be very predictive of market sentiment during the day, and patterns are easy to see developing when using 15-minute candlestick charts.
I use candlestick charts for nearly all of my analysis, both longer term and shorter term, as my eyes have become trained to see only what is important to recognize high-probability trades.
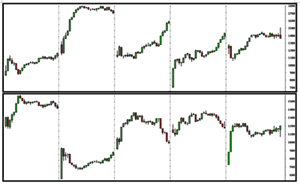
Here is an example, over a five-day period, of what I would be looking at with the advancers above the decliners:
Click to Enlarge
Although I could look at just one or the other of the charts above, or even overlay the two, or even use an Advance/Decline (A/D) line chart, I love looking at the relationship between the advancers and decliners in this way. Higher highs and lower lows, plus other strategic patterns that I like, can easily be seen developing, and therefore make it easy for me to make high-quality decisions.
You can clearly see on day one above how the advancers pulled back quickly as
the decliners obviously ran up. That would have been a great time to take an
early short position.
On day two, you can see how the advancers
moved rapidly up after the open, and, of course, how the decliners fell. On this
day, it was easy to see getting long early was the best choice.
Day three gave an entirely different picture, showing us to go short early and long towards the end of the day. We can see easy-to-read patterns develop most every day, and this provides more confidence when taking trades.
On most days, both the NYSE and Nasdaq move about in sync, however, if they move with a divergence, I can either move into a strong or weak sector, or just stand aside until the criteria meets my strict requirements.
Looking at the relationships on these charts helps me know when to get in to trades and how to manage them.
I do use a few other common indicators in my analysis, but all are equally easy to use. Most traders, including myself (in the past), tend to make things more complicated than they need to be, and why wouldn't we all just want to find the easiest path towards profitability?
To learn more about trading with the Advance/Decline (A/D) line, please read "One Indicator Stock Traders Must Follow."
By Ron Wagner, active trader, investor, and principal partner, RevolutionaryTrading.com


