A timely look at the charts for gold and silver reveal the important support/resistance areas as well as price targets that traders can use in planning and executing short-term trades, writes Corey Rosenbloom.
Let’s update a key situation we’re following in the commodity markets of gold and silver. Both markets are showing similar bullish divergences at support, which gives us a key level to watch for any reversal—or breakdown/failure—in the weeks ahead.
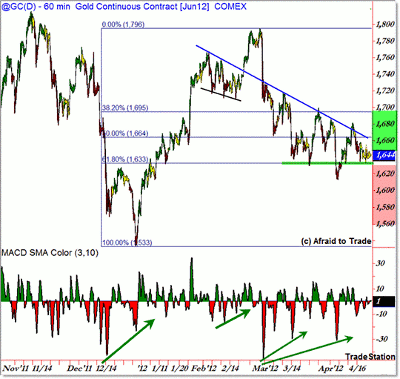
Let’s start with gold to note the key trigger and target levels along with the divergences:
Though we saw a sharp bounce from $1,620 to $1,680 after that update, price has returned to challenge the $1,640 level which will be critical going forward.
I’m showing a color-coded structure chart to highlight the key declining trend line, which currently intersects the 50% downside Fibonacci retracement at $1,664.
Traders could look to a price breakthrough above this level as a potential bullish trigger for a continuation move expected into $1,700 for a minimum/small upper target.
That’s the bullish suggestion from the repeated bounces off support and the persistent positive momentum divergences; but an upside outcome is by no means guaranteed.
Instead, should price break under $1,630 and then continue trading to the $1,600 level, look for a round of liquidation and bearish positioning, particularly on a breakdown under the $1,600 round-number confluence level.
While odds tilt towards the bulls above $1,640, each lower price support level that breaks serves to tip the scale more to the bearish side until odds would favor a breakdown under $1,600.
NEXT: Latest Technical Picture for Silver
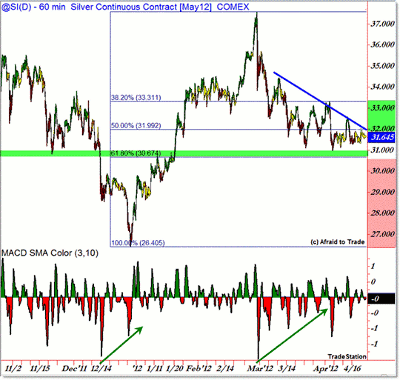
|pagebreak|The structural picture is very similar in silver (support divergences):
Silver experienced a more prominent spike higher at the end of February that took out the November 2011 price high (unlike gold). From there, price has retraced in an intraday downtrend fashion all the way back to the $31 level, which is just above the 61.8% Fibonacci retracement and “price polarity” level at $31.60 from prior support and resistance (mini reversals).
That being said, we’ll be watching silver relative to the horizontal green support bar I drew just under $31. For reference, silver becomes a potential breakout buy candidate above the falling trend line at the $32.00-per-ounce level.
Above $32 suggests a continuation move back to the $33 level, and beyond that on a trigger break above $33 resistance (Fibonacci and price polarity).
For these related markets, keep focused on the defined horizontal support levels along with the falling trend line for potential trading triggers on any breakout.
By Corey Rosenbloom, CMT, trader and blogger, AfraidToTrade.com
Corey will be speaking at the Dallas Traders Expo in June. Sign up now to attend free!


