
Two critical price levels are evident on the chart for Chipotle Mexican Grill (CMG), writes Corey Rosenbloom, identifying these levels and potential trade set-ups that would be presented if either gives way.
Many traders have been following the stellar move in Chipotle Mexican Grill (CMG), though the recent sharp pullback has spooked many participants. It’s a great chance to show how I analyze various chart price action to get an idea of where a stock may be headed.
Let’s take a look at the key short-term price levels (and chart structure) to watch for potential opportunities in the weeks ahead.
First, the daily chart levels:
Click to Enlarge
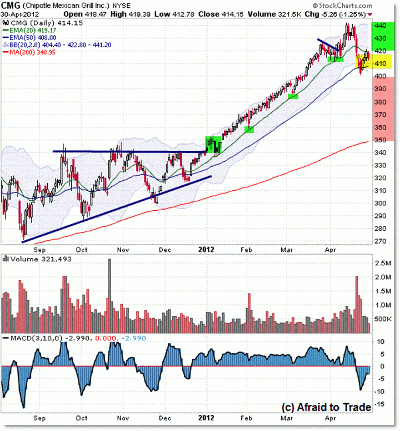
Two main levels have developed on the chart, which are emphasized on the intraday chart below:
- The first is the upper resistance from the falling 20-day exponential moving average (EMA) at $420
- The second is the lower support via the rising 50-day EMA ($404) and round-number support at $400, which is also the April 2012 swing low
Luckily, these serve as easy reference levels: $400 and $420.
Let’s take a moment to discuss a few more factors from the daily chart before focusing on these levels. The most obvious development is the “creeper” power rally through early 2012 that provided an extra-stable angle of ascent in price. You just don’t see patterns this clean very often.
The rally produced a mini bull flag and successful retracement test of the rising 20-day EMA in early April.
From there, price pushed one more time to $440 ahead of the sharp retracement/decline that brings us to our current position between these two bull/bear reference levels. The potential for a trend reversal exists if price breaks under the $400 level. That’s something CMG bulls must watch carefully.
However, the bears must be on guard for a turnaround rally and breakthrough above the $420 pivot level. A move above $420 suggests a resumption of the uptrend and continuation swing back to the $440’s highs.
These will be the two objective scenarios that lead us to the game planning in real time: bullish for trend continuity if above $420 or bearish for trend reversal under $400.
NEXT: Intraday Chart Further Clarifies the Picture
|pagebreak|The intraday chart from Monday clarifies the picture:
The intraday chart with the recent volume and momentum divergences—at the moment—tends to favor the bears aslong as price remains under the $415 pivot (EMA confluence). The potential for a short squeeze exists between $415 and $420 (the neutral zone).
Finally, the bullish breakout buy trigger develops above $421 and $422 (to be safe). If you’re active in trading CMG shares or options, keep these levels in mind in addition to the additional signals/trades you are managing.
Click to Enlarge
You can use this type of chart analysis on any market to better understand where price has been and how it can guide you as a trader to where it will go next.
How you do you analyze charts to find good trades? Let us know in the comments below.
By Corey Rosenbloom, CMT, trader and blogger, AfraidToTrade.com
I’ll be talking about this topic and others during my free workshop at the Dallas Traders Expo in June. Register free today and I’ll see you there!


