Being able to determine market direction is a trader's most important skill, writes Markus Heitkoetter, drawing this three-part series to a close by teaching a simple method for determining market direction.
In this final article from our three-part series "How to Be a Trader," I will show you a simple way to easily identify the direction of the market.
We have already discussed in the previous article that being able to determine the direction of the market is one of the most important skills of a trader because it dictates the type of trading strategy you use. In a trending market, you want to use a trend-following strategy, and in a sideways market, you want to use a trend-fading strategy. For more information on this topic, please review Part 2 here.
How to Identify the Direction of the Market
Way back in the 90s, I used fundamental analysis to try to predict the market. Long story short, it didn't work for me.
Since the mid 90s, I have been usingtechnical analysis in my trading. When using technical analysis, there are two different approaches, chart patterns and indicators.
Examples of chart patterns are flags, pennants, triangles, double bottoms and double tops, etc. Candlestick formations are chart patterns, too.
Examples of indicators are moving averages, Bollinger bands, MACD, RSI, etc.
So which approach is "better," and should you use chart patterns or indicators to identify the direction of the market?
Easy answer: Use the approach that works for you. I personally use indicators. I like the black-and-white approach. As an example, the RSI is either above 70 or it is not. There's no grey area.
I openly admit that I struggle to identify chart patterns while they are forming. Don't get me wrong, I am an expert in showing you every single chart pattern there is at the end of the day, but I can't identify them with certainty while they are forming. But hey, I can't ride a bicycle either, so maybe there's something fundamentally wrong with me!
Using Indicators to Identify the Direction of the Market
In my own trading, I use three indicators to determine the direction of the market. Today, we will talk about my favorite indicator, which are Bollinger bands. Bollinger bands are a fascinating concept and are available in every charting package.
(Note: If your charting software does not allow you to plot Bollinger bands, it's time to switch to a different software provider. Let me know if you need help finding a suitable charting software platform.)
NEXT: Using Bollinger Bands to Identify Market Direction
|pagebreak|Bollinger bands consist of a center line, which is a simple moving average, and two standard deviations, one above the center line and one below. These are called the upper Bollinger band and the lower Bollinger band.
I like to use a setting of 12 for the moving average and a setting of 2 for the standard deviation.
And here's how to use the Bollinger bands:
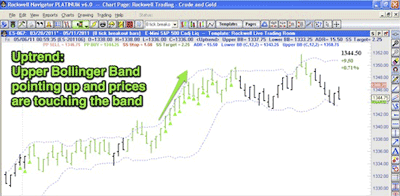
In an uptrend you will see that the upper Bollinger band is pointing up in a nice 45-degree angle and prices are touching the upper Bollinger band. The upper Bollinger band acts like a trend line above the prices.
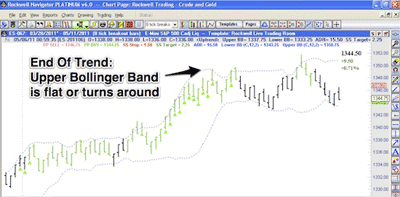
So how do you know when an uptrend is over? The uptrend is over as soon as the upper Bollinger band flattens or turns around.
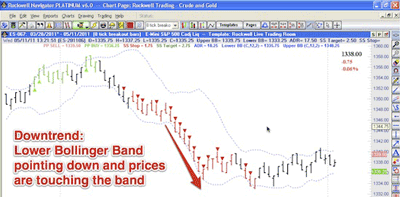
In a downtrend, you will see that the lower Bollinger band is pointing down in a nice 45-degree angle and prices are touching the lower Bollinger band. The lower Bollinger band acts like a trend line below the prices.
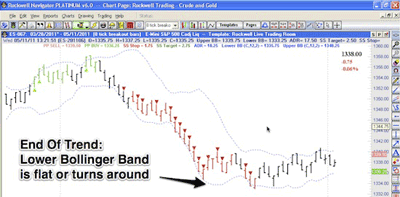
The downtrend is over when the lower Bollinger band flattens or turns around.
Try it out for yourself:
- Pull up your charting software, plot the Bollinger bands on the charts
with a setting of 12 for the moving average and 2 for the standard deviation
- You can use it with any time frame, but if you are daytrading, you might want to use a five-minute chart
- Look at the current value of the upper and lower Bollinger bands. Based on the definition that I gave above, what is the market doing right now? Is it in an uptrend or in a downtrend?
- Now look back at the charts. Can you see how the Bollinger bands are showing you the trends?
You shouldn't have difficulty determining whether a market is going up, down, or sideways based on this simple definition. If you do have problems, let me know and I'll be happy to help.
Keep in mind that this is not a trading strategy in itself; it's just a way to determine the direction of the market.
Summary
You can use chart patterns or indicators to help you identify the direction of the trend. I personally rely on indicators because for me they are more "black and white."
My favorite indicators are Bollinger bands. They offer an easy way to determine whether the market is trending or going sideways.
By Markus Heitkoetter, founder and CEO, Rockwell Trading


