
With a host of chart, volume, and sentiment signals showing bullish patterns, Willem Weytjens of Profitimes.com tells why a significant bullish move for gold, gold mining stocks, and even silver could be in the making.
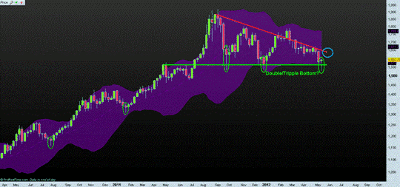
Gold has now made a bullish reversal on a weekly basis, as price rallied sharply on Thursday and Friday. Support held, which means gold could be on the verge of setting a double/triple bottom around $1,550:
Click to Enlarge
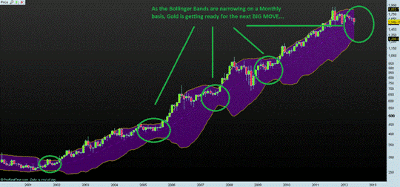
On a monthly basis, we can see that the Bollinger bands are narrowing, indicating that volatility has been low over the past couple months (although it might not have felt like that for some traders).
Volatility will not stay this low forever, so gold is now getting ready for the next big move. Notice that I am talking about a monthly chart here, and not about the day-to-day volatility (which has been quite extreme from time to time).
This also means that it might take several more months before the next big move actually starts. However, keep an eye on the monthly Bollinger bands, and follow the trend when the next big move starts.
Click to Enlarge
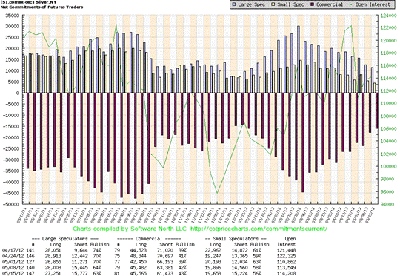
For silver, shorter term, we can see that the commercial traders have reduced their net-short positions in silver to 15,980 contracts, a level not seen since late 2011, a time when silver set a bottom at roughly the same price level as where it is trading today:
Click to Enlarge
See also: Concurrent Signs of a Gold, Silver Bottom
NEXT: Why Gold Mining Stocks May Soon Rally
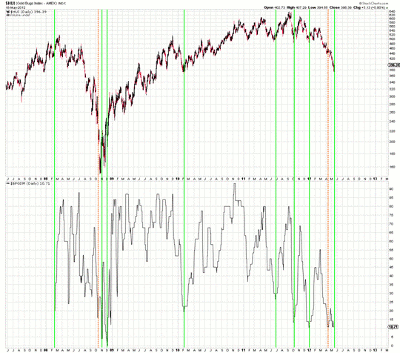
|pagebreak|For gold mining stocks, the chart below illustrates the fact that sentiment is extremely low, as illustrated by the bullish percent index, which shows the percentage of stocks with a buy signal on the point-and-figure charts.
The green vertical lines show that almost every time sentiment is depressed, the Gold Bugs Index ($HUI) is about to turn up. The only two times it didn’t mark a bottom was in late 2008, and more recently, a couple of weeks ago.
Click to Enlarge
Not only is sentiment in gold stocks depressed, but it is also depressed relative to sentiment in the S&P 500, as illustrated by the chart below, which plots the ratio of $BPGDM by $BPSPX (the percentage of stocks in the S&P 500 with a buy signal on the point-and-figure charts).
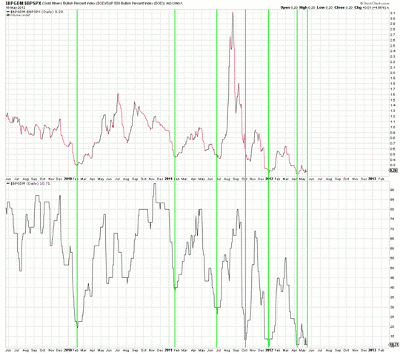
Click to Enlarge
We can see that whenever sentiment in gold miners (lower part) was depressed, it was not just “depressed,” but it was also depressed relative to sentiment in the S&P 500, and soon, sentiment turned up in favor of gold mining stocks.
See also: Has Gold Formed a Bottom?
By Willem Weytjens of Profitimes.com


