Fibonacci retracement levels can be used to predict and trade price action both long and short in any market, writes Johnathon Fox, contributor to DailyForex.com.
Fibonacci is a tool that is very popular with many technical and price action traders in all types of markets. The Fibonacci theory was created by 13th century mathematician Leonardo Fibonacci. Fibonacci is an extremely well-known mathematical series of numbers with each number being the sum of the previous two. An example of this is: 0, 1, 1, 2, 3, 5, 8, 13, 21, 34, 55….
The Fibonacci tool is widely used by traders to predict levels of support or resistance in a market. It can also be used for predicting where price may retrace before continuing on with the overall trend. Using Fibonacci this way can help traders get into trades at a premium price to where other market participants are entering.
The most widely and commonly used Fibonacci levels are 38.2%, 50%, and 61.8%. Whilst the 50% level is not technically a Fibonacci ratio, this level is commonly used because of the tendency for markets to retrace to the 50% level before trading back in the original trend’s direction.
See also: 4 Fibonacci Ratios to Know Inside Out
Fibonacci is normally used by taking two extreme points (the high and low) and measuring the key Fibonacci ratios in between.
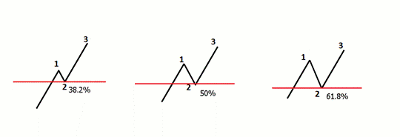
An example of the three common levels and how to use them is below. In these examples, all 3 diagrams are in an uptrend. They all retrace lower to a Fibonacci level before again moving higher with the trend.
The number 1 on the above diagrams is the first move higher. This is followed by number 2, which is the market retracing lower to the key Fibonacci level. It is here at these key levels where price action traders would be looking for solid price action and hints from the market to get long with the uptrend. Number 3 represents the market respecting the key Fibonacci levels and moving back higher.
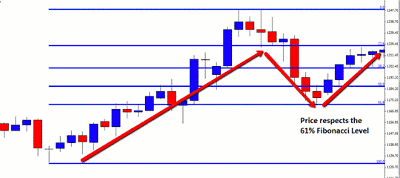
The chart below shows how this pattern works on candle charts. Price has been moving higher; a retrace back lower falls into the 61% Fibonacci level; and the market respects this key Fibonacci level and again moves higher, completing the pattern.
NEXT: Using Fibonacci to Short the Markets
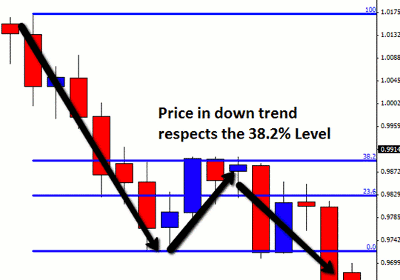
|pagebreak|The Fibonacci pattern can be used the exact same way when traders are looking to short the market. The only change is traders are looking to get short and are looking for retraces back higher into key Fibonacci levels to get onboard the downtrend.
An example of the Fibonacci tool being used in a downtrend is below. Notice price is stopped at the 38.2% Fibonacci level before again moving lower.
The Fibonacci tool can be a very successful tool when used correctly. To increase the chance of placing a wining trade, traders should look for price action at the key Fibonacci levels to confirm a trade.
As suggested with all new trading techniques, make sure you practice this technique with a demo account before ever considering going live. Until you have proven you can use this tool and profit consistently on a demo account, do not start live trading! If you can’t make money on a demo, you have no chance once trading live!
See also: Fibonacci Analysis: Master the Basics
By Johnathon Fox of Forex School Online
Johnathon Fox is a professional forex and futures trader who also tutors and mentors aspiring traders worldwide at Forex School Online.


