
Daytraders love Baidu, Inc. (BIDU), and Greg Harmon of Dragonfly Capital identifies new candle chart signals—including a “death cross”—that paint a decidedly bearish short-term picture for the stock.
Japanese candlestick trading techniques have been powerful tools for centuries. Using those tools and a very basic Western rule, the chart of Baidu, Inc. (BIDU) is screaming to short the stock. Let me explain.
The chart below shows the price action for BIDU over the last six months. The most important candles are the four last ones. The doji with a long upper shadow on June 6 was a shooting star doji, gapping above the previous two rising candles that looked to be reversing a bottoming action.
See also: Trading with Candle Charts
The shooting star signals a potential exhaustion to the upside as the price action falls back significantly to close the day. It generally needs to be confirmed by a lower close the following day to signal a reversal.
This was followed by a second shooting star doji gapping higher again. It was confirmed the following day by a hammer, another potential reversal candle, which closed below the shooting star doji close.
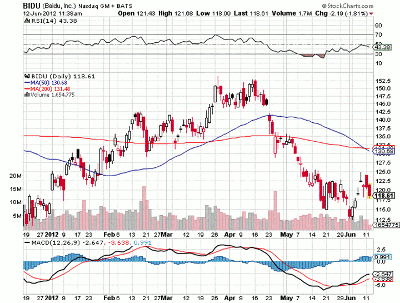
Click to Enlarge
The hammer reversal also needs confirmation, and it found it on Monday with a long red candle closing below the hammer close. Three potential reversal candles and two confirmations, these four candles signal a sell. This says nothing about how far it goes; that is left for other techniques.
Not convinced? Then let’s bring out the Western rule: Tuesday printed a bearish cross of the 50-day simple moving average (SMA) down through the 200-day SMA. This cross, known as the “death cross,” is a sell signal for many. Death cross certainly sounds bearish afterall, right?
By Greg Harmon of Dragonfly Capital


