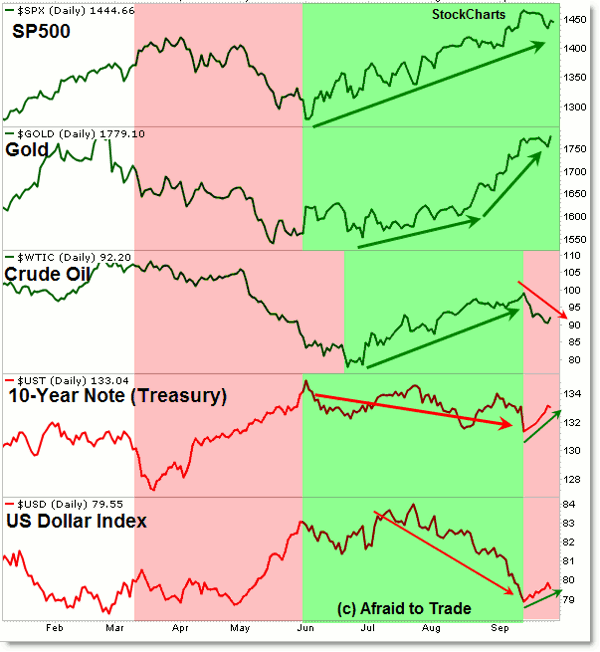
As the third quarter wrapped up, CMT Corey Rosenbloom outlines his most recent intermarket picture below.
What does the intermarket picture show in terms of current money flow to Risk-On or Risk-Off Markets? Let’s take a quick look to the end of September 2012 and the third quarter:
The chart above shows three “Risk-On” Markets (Stocks, Gold, and Crude Oil) juxtaposed with two “Risk-Off” Markets (10-Year Treasury Note Price and the US Dollar Index).
The length of the chart shows all of 2012 so far in terms of money flow which gives us a clearer picture of what’s happened and what’s occurring currently.
As traders or investors, we’re always trying to answer the question of “Trend Reversal or Simple Retracement” and that dynamic is playing out currently. Until mid-September, the money flow picture was clear: Money consistently flowed towards the Risk-On markets and away from the Risk-Off markets.
From mid-September to end September, we see visual strength (at minimum, a sharp retracement) up in the US Dollar Index and Treasuries, which corresponded with a sharp retracement/sell-swing in Crude Oil. While that was clear, the picture in stocks and gold was not as clear—stocks and gold traded sideways (minimal retracement) when compared with the other related markets.
As we turn the corner into October, we’ll need to focus on the question of “Retracement vs. Reversal” in the context of the recent counter-trend swings in these markets. For example, focus on support in the “Risk-On” Markets such as 1,430 in stocks, $1,760 in Gold, and, of course, $90 in Oil.
In terms of the Risk-Off Market Resistance, keep your eye on the 133/134 level in Treasuries and, of course, 80 as resistance for the US Dollar Index. Whether these levels break or hold (the broader trends continue) will be key to determining the next swings and plays on the broader intermarket “money flow” perspective.
by Corey Rosenbloom, Founder and President, Afraid to Trade


