Earnings season in the US is starting to wind down, but in Europe, they are just getting started. The staff of Forex.com gives us a view of both the US and European equity markets during earnings season and the implications.
The stock market has found it hard to break through some key resistance zones recently, which has left major stock indices treading water. We are in the middle of Q3 earnings season, so will corporate results and guidance for Q4 help to give the market some much-needed direction?
Understanding stock markets:
For those who are new to trading stocks, there are three key drivers of equities:
- The macro environment - the overall economy and growth levels
- The micro environment - corporate results, company news, personnel etc.
- The technical picture
1. The macro environment
The Fed's unlimited bond purchases for QE3, announced in September, combined with the OMT in Europe should ensure there is ample liquidity in the financial system. Added to this, inflation pressures remain fairly low in the Eurozone and the US, which is also traditionally stock positive. However, to counter-balance this “good” fundamental news is the threat of the fiscal cliff in the US, which is causing uncertainty in the markets. If we fall off the edge of the cliff then the US could be plunged into recession next year, which could hurt corporate profits, especially in the US.
2. The micro environment
Q3 earnings are in focus right now and so far the outcome has been disappointing. There have been earnings misses for the oil and gas and basic materials sectors along with the tech sector, which has had some notable earnings misses from the likes of Microsoft, IBM, Google and Intel. Earnings in the tech sector are 10% lower compared to this time a year ago as sales have been disappointing.
Financials may be the stand out performer, but big US banks are bouncing back from extremely low bases after a torrid few years. Including the financial sector, 30% of companies on the SPX 500 have missed their earnings estimates; excluding the financial sector this is more like 40% of companies who have missed estimates.
NEXT PAGE: The SPX Suffers from its Own Success
|pagebreak|But stock investors aren't that concerned with what happened in the past, they want to know how the next 6-months will fare. Right now the signs are not good. Caterpillar is one of the largest US companies to cut their full year profit forecasts. And that is not the only worrying sign. Although earnings remain in positive territory overall, sales growth has been falling. This suggests that companies have had to cut costs in order to boost their bottom lines. This is unsustainable and unless sales pick up in Q4 it is hard to see how earnings can continue to grow.
Right now earnings estimates for Q4 are quite strong. However, if the economy does not pick up steam in the next couple of months then estimates may have to be revised lower.
Sales and Earnings Surprises for the SPX 500.

Source: Bloomberg
Click to Enlarge
Earnings season is only just kicking off in Europe, but so far in the Eurozone the news has been fairly upbeat. Only 7 of the 50 companies in the Eurostoxx index have reported results and all of them beat their sales estimates, while two thirds beat their earnings estimates. This does not mean that the Eurozone is outpacing the US, rather that investors were a lot more bearish on the Eurozone than the US and companies on the Eurostoxx index have found it easier to beat earnings estimates. Likewise, companies in struggling economies like Spain have surprised on the sales side, although earnings remain lower.
IBEX Earnings and Sales Surprises by Quarter

Source: Bloomberg
Click to Enlarge
In the UK, it is still early on in the Q3 earnings season, but so far the news has been positive for the FTSE 100, however, it is too early to give a definitive analysis.
The SPX Suffers from its Own Success
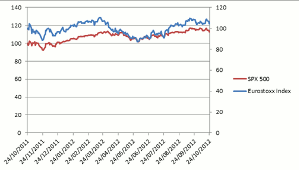
There are two things that could weigh on the SPX 500 versus its European counterpart in the coming months. 1: The fact that earnings estimates for 2012 as a whole are still too high, and 2: the fiscal cliff remains unresolved and could hurt sales and earnings potential as this uncertainty continues to grip the economy. It will not be known if this problem will be averted until January. The worst outcome of the November 6 Presidential election would be a split—with Congress from one party and the President from the other. If the November 6th election doesn't hand a decisive victory to one party then we could see stocks in the US come under pressure relative to the European counterparts and we could see the Eurostoxx index outperform the SPX. Remember, the SPX 500 is still up 15% so far this year, so it has further to fall if concerns about the fiscal cliff start to escalate.
The SPX 500 and the Eurostoxx index, normalized. They have been moving together, but European stocks are less at risk from missing earnings estimates than US stocks, because estimates are already low.

Source: Bloomberg and Forex.com
Click to Enlarge
NEXT PAGE: The Technical Picture
|pagebreak|But if the fiscal cliff is averted then the market may stage a powerful relief rally and we could see the SPX 500 push through important resistance levels.
3. Technical Picture
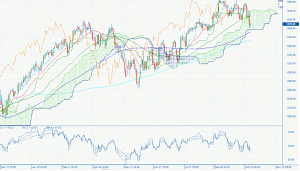
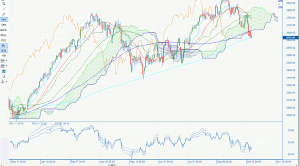
This brings me to important technical levels to watch out for. 2,900 proved to be too large a hurdle for traders in the Nasdaq, 1,450 thwarted the bulls in the SPX 500 while 5,900 and 2,600 were key resistance levels in the UKX 100 and Eurostoxx 50 index. The reversal from these levels suggests that bullish sentiment has weakened. Right now most indices are still in technical uptrends, but will they last? Also find out why the Nasdaq may point to further weakness.
SPX 500:
This cross has come under downward pressure and we are close to some key support zones. If we break below 1,399—the base of the Ichimoku cloud chart—then we could see further downside.

Source: Bloomberg and Forex.com
Click to Enlarge
Nasdaq:
This index is considered a good lead indicator as it contains tech stocks, which are highly correlated to the economic cycle. This cross is already below the base of the daily cloud, and thus is in a technical downtrend. This does not bode well for other stock markets as weakness in tech stocks can sometimes precede a broader economic weakness. 2,650 is a key support level—the 200-day sma. Below here could see further downside to the early summer lows between 2,450 and 2,500.

Source: Forex.com
Click to Enlarge
Eurostoxx 50:
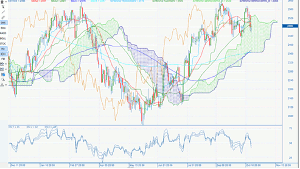
This index has been more resilient than its US counterparts, however there are a couple of things that could ruin the party for European stocks: 1: earnings data as Eurozone stocks are behind the US in the earnings calendar, and 2: weak economic growth in the coming months.
As we mention above, when it comes to earnings in Q3 the bar is lower for Europe compared to the US, and a lot of bad news is already baked into the price of equities this side of the Atlantic. This could lead to some outperformance of European equities compared to the US if we see European earnings surprises in the coming weeks. However, the bleak economic outlook for both the periphery and the core in the Eurozone could limit future gains and we believe that this index may remain range- bound between 2,370 and 2,570 in the medium term.

Source: Forex.com
Click to Enlarge
By the Staff of Forex.com


