In this article, Corey Rosenbloom of AfraidToTrade.com provides a quick overview of three factors that highlight the importance of the 1,410 level in the S&P 500.
As we transition to December soon, let’s take a look at the critical level to monitor in the S&P 500 (SPX) to determine our trading strategies as December approaches.
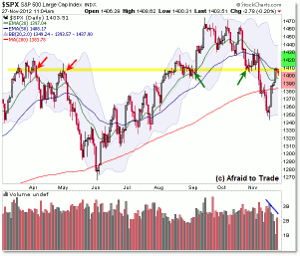
Here’s the top-level daily chart with key level highlighted:
Cutting straight to the point, the key inflection level is 1,410, which reflects the confluence of the following:
- Falling 50d EMA (1,408)
- Price Polarity Level (Highlighted near 1,410)
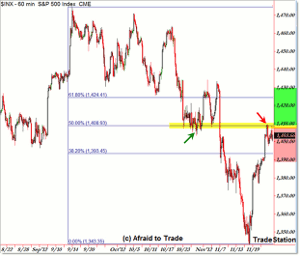
- 50% Fibonacci Retracement (1,409)
There are of course other factors that align at the 1,410 index level, but we’ll focus on these three.
In trends, the 50 EMA tends to be a “line in the sand” that holds as price retraces to this level. Breakthroughs beyond the 50 EMA tend to signal potential trend reversals, not continuation.
For reference, the short-term (Daily) trend is DOWN as evidenced by the series of lower highs/lower lows and the bearish moving average orientation (20 under the 50).
When referring to price polarity, it refers to the longstanding charting principle: Prior support often becomes future resistance.
The highlighted line reflects the polarity of both support and resistance at 1,410 where price trades now.
Finally, we have the 50% Fibonacci retracement as drawn on the hourly chart:
From the September high of 1,474 to the recent November low at 1,434, we observe the 50% half-way point intersects at 1,409.
Logic would suggest that price retraces lower from this level but as traders, we must be able to adapt in real time IF instead buyers continue to push the market above 1,410 on this upward swing.
An inflection point gives us a roadmap for planning our short-term strategies according to what actually happens in real time.
A “logical” expectation would be for price to stall and trade lower from here (bearish intraday/swing trades if so toward 1,390 at least).
An “alternate” outcome would be that price instead breaks firmly above the 1,410 inflection/pivot level, which would likely result in a new wave of buying pressure (especially from short-sellers who entered short into this level and are forced to buy back to cover).
A breakthrough above 1,410 would not just trigger buy-to-cover orders from the bears; in addition, sidelined bulls could step back into the market with fresh breakout buy orders along with other traders adding to existing positions for a breakout opportunity.
Continue watching this level throughout the day and the remainder of the week and adapt accordingly.
By Corey Rosenbloom, CMT, Trader and Blogger, AfraidToTrade.com


