Elliott wave analysis stands above all other methods of forecasting financial markets, according to Nico Isaac of ElliottWave.com, as we shares a recent example of the method in action in soybeans.
Nobody said it's easy. In fact, when it comes to investing in commodity markets, people have said just the opposite. A novice to the world of futures recently put this spin on the matter: Trying to stay ahead of the volatile price fluctuations in commodities is like trying to tame a tornado.
So, how do you tame a tornado?
Well, let's just say you're going to need a really wide net. And that net is Elliott wave analysis.
Put simply, Elliott wave analysis stands above all other methods of forecasting financial markets: First, it is objective. Elliott analysis states that the main force driving price changes is the collective psychology of investors surrounding a specific market. This psychology unfolds in clear and observable Elliott wave patterns on price charts.
Second, it's one of the few truly dynamic forms of technical analysis. Unlike most stay-and-wait technical measures—which identify the potential trend and have you wait for it to unfold in the right direction—Elliott wave analysis helps you accommodate new developments in price action.
To that end, Elliott wave patterns adhere to specific rules and guidelines that establish the subdivisions of specific wave structures. For example, here are the three cardinal rules of five wave patterns:
1. Wave 2 cannot retrace more than 100% of wave 1
2. Wave 3 can never be the shortest among waves 1, 3 and 5
3. Wave 4 cannot enter the price territory of wave 1
Elliott wave analysis also uses Fibonacci ratios to identify active critical support and resistance levels. These “lines in the sand” are marked above and below price action. Leaving support intact gives the green light on a wave count. While penetrating resistance renders a wave count invalid before it's too late to get out.
Now that we've told you how Elliott wave analysis works, allow us to showyou. Today we're using a recent lesson from Daily Futures Junctures, where EWI's senior commodities analyst Jeffrey Kennedy has stayed one step ahead of soybeans.
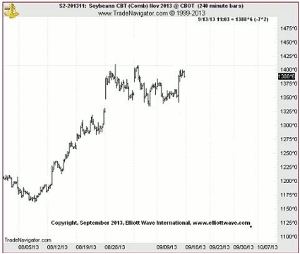
First take a look at the following price chart of November soybean futures. In early August, soybeans moved to the upside in a powerful rally to an 11-month high by month's end. “Massive panic buying sends soybeans futures soaring” reported one August 26 news source.
Early in the uptrend, the August 8 Daily Futures Junctures set its sights immediately higher in soybeans. Yet, while Jeffrey Kennedy was near-term bullish, his one-two, one-two aggressive labeling suggested any rise would be short-lived.
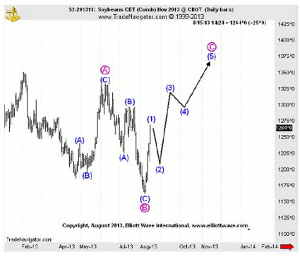
“The manner and extent of today's move up suggests that wave (1) is finished and that wave (2) is in force. Critical support for this short-term bullish outlook is 1162.”
Four days later, Jeffrey identified critical resistance for the larger bearish view in soybeans at $12.96, the level at which wave (2) would violate the rule to never retrace more than 100% of wave 1.
On August 15, soybean prices penetrated the $12.96 area, so Jeffrey adjusted his wave count to prepare for still higher prices. He then outlined his scenario via the following chart:
From there, soybeans confirmed Jeffrey's bullish wave relabeling and soared above the $14 per bushel level before tapering out at month's end.
By Nico Isaac of ElliottWave.com


