
Trader Joey Fundora of DowntownTrader.com breaks down Fossil’s chart and points out why he likes the stock and what makes it attractive.
I mentioned today that Fossil (FOSL) was “clearing the past week’s range and could be ready to attempt a move towards yearly highs,” and I received a response asking why I thought it was headed to new highs. Of course, I don’t know that it’s headed to new highs, but the price action is leading me to believe it will attempt to make a run at this year’s highs. I’ve received other questions recently on what I look for and thought it would be a good idea to break down what I see in the chart.
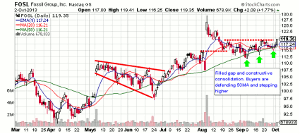
Click to Enlarge
FOSL had a strong gap on earnings in August that has resulted in a lengthy consolidation. It really had no follow through and traders that bought that gap are likely frustrated with the stock. However, FOSL had already run up into earnings before the breakout and investors that were holding prior to the earnings gap are still comfortably in the money. The reason I mention this is that the price action in FOSL is typical of a healthy consolidation. Sure the failure to continue running after earnings may be seen as a sign of weakness, but the stock never really reversed, and FOSL has quietly been finding support on dips.
Traders have been willing to pay higher prices on recent trips to the 50-day moving average and FOSL is now on the cusp of breaking over several week highs. So the short answer is I like this chart because it MAY be near the end of a consolidation, and its recent highs should act as a magnet if it can clear the mid 119′s. Overall, it’s a bullish stock in a good sector. Whether it gets there or not, there are enough signals in the chart to have made it attractive to me.
That being said, I don’t own this stock as I already had enough risk on with my current portfolio, but hopefully breaking it down this way may be of value to some of you.
By Joey Fundora, Trader and Blogger, DowntownTrader.com


