
Rounded reversals occur as a result of a gentle, as opposed to violent, transfer of supply to demand and technician Corey Rosenbloom of AfraidToTrade.com shows how you can recognize the pattern.
How do you recognize an intraday “rounded reversal” developing in real time?
Let’s take a look at the near-textbook example from October 1 and learn three factors that tend to precede—or trigger—an intraday rounded reversal or “failed trend day” pattern.
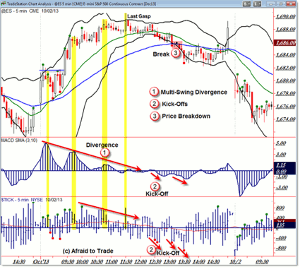
Here’s the 5-minute @ES futures chart with the three main factors highlighted:
Click to Enlarge
First, a trend day often begins with pre-market news/activity and an opening gap. A true trend day begins with a gap and price continues moving in the direction of the gap for the rest of the session.
Just because price starts the day with an opening gap and continues moving in the direction of the gap does not mean it will spend all day doing so.
When price starts the session as a trend day but fails mid-session, we call these “failed trend days” or “rounded reversal” sessions.
There are three main factors that tend to precede and trigger a rounded reversal in motion:
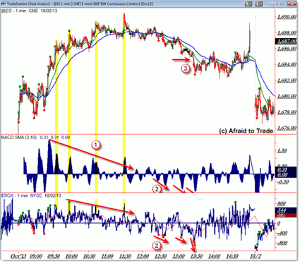
1. Multi-Swing Negative Divergences
Using the 3/10 momentum oscillator (or similar indicator such as rate of change) or market internals such as NYSE TICK or breadth, we can compare intraday price highs with corresponding oscillator highs.
If price continues to push to new intraday highs but our oscillator or market internals registers lower highs, it serves as a non-confirmation as a divergence builds.
While it’s common to see divergences on any trend day, be on guard for MULTI-swing divergences.
2. Kick-Off Signals
Similarly, if we see price swinging down off an intraday high, it’s likely just another typical retracement.
However, if we see our oscillator and/or market internals make new lows for the session, this calls the “simple retracement” into question and suggests it may be the first swing down in a new downtrend at a key reversal.
This is similar logic to Richard Wyckoff’s “sign of strength” or “sign of weakness.”
I use red and green dots in TradeStation to highlight new intraday highs or lows for easy comparison.
3. Price Breakdown
Indicators are helpful, but we make trading decisions and final confirmation with price itself.
The final signal or the third step in a rounded reversal is both a factor to watch and a trading trigger/entry signal (in this case, short).
When price breaks under the 50 EMA or corresponding intraday trendline on a 5-minute chart, it typically signals the official end of the trend day in motion.
It’s also a low-risk, tight-stop trigger-entry point to play for the potential downward swing yet to come if indeed the session unfolds as a rounded reversal.
Here’s the same three-step process on a 1-minute @ES chart:
Click to Enlarge
Keep in mind also that the real-world trading environments—like this one—can differ from the textbook definitions with “spikes” or “last gasp” rallies such as that, which happened at 11:30 am CST on October 1, or in fact, the surprise spike higher into the close.
Ultimately price did reverse lower to continue the rounded reversal—the final target is often a retest of movement down toward the prior swing low (1,677 in this case).
This is just one example of the intraday version of the rounded reversal concept, but we can see it play out on higher frames and in various markets as well.
By Corey Rosenbloom, CMT, Trader and Blogger, AfraidToTrade.com


