October can be hard on stock market investors, but the Halloween Indicator lies just ahead, writes John Nyaradi of Wall Street Sector Selector.
October 19, 1987 was the date of Black Monday when the Dow (DIA) dropped 22.6% in one day. Now as the end of October approaches, the Halloween Indicator could flash a buy signal just ahead.
Halfway through October 2013, the markets are doing well and at new highs in spite of the government shutdown, debt ceiling debate, and weak earnings.
October has always been a scary month in stock market history, the scene of many crashes but also the start of many bull markets.
The government is back to work but the shutdown will apparently clip 0.5% off Q4 GDP and the stage has already been set for another showdown in December and a second in January, 2014.
Now with just a week or so to go in October, major US markets are hoping to escape unscathed and not experience an event like some of the following:
- Black Friday: Oct. 29, 1929: Dow Jones drops 12.8%.
- Black Monday: Oct. 19, 1987: Dow Jones loses 22.6%.
- Friday the 13th, 1989 Mini-Crash: Dow Jones falls 6.91%.
- Oct. 27, 1997 Mini Crash: Dow Jones drops 550 points, or 7.2%.
- Black Week: Beginning Oct. 6, 2008: Dow Jones drops 18.2% for the week.
- Oct. 15, 2008: Dow sinks 733 points (7.87%)
- Oct. 22, 2008: Dow falls 514 points (5.69%) after weak third-quarter earnings season drives home the message that the recession is seriously bad.
On the radar ahead is the resumption of government economic reports and more third quarter earnings, which have been mixed, at best. IBM dragged down the Dow last week while Google powered a surge in the Nasdaq (QQQ) and the S&P500 (SPY) set new nominal all-time highs.
At the outset of second quarter earnings season, analysts had been expecting to see third-quarter earnings for the S&P 500 demonstrate 5.1% growth. After S&P earnings for the first quarter rose 2.4% and second-quarter earnings indicated 2.7% growth, many analysts have been touting the expectation that growth would accelerate in the second half of the year.
However, the long-awaited lift-off now seems to have been delayed, as third-quarter earnings growth is forecast to be a feeble 1.3%.
However, October is also historically the start of many bull markets and the start of the “best six months of the year,” according to Stock Traders Almanac. The Almanac says that most market gains come between November and May and so bulls are looking forward to the potentially ghoulish October to give way to the powerful year-end rally that we oftentimes see.
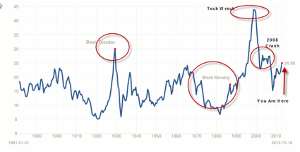
Nevertheless, amid all of the recent exuberance, a glance at the following chart is reason for pause:
The chart is a graphic indicator of how current conditions regarding price/earnings puts us in the region of significant market declines and so at least a measure caution is perhaps in order as we move through the last week of October.
In the weeks ahead, bulls can look to high beta ETFs like the iShares Russell 2000 ETF (IWM), which is at an all-time high, with a relative strength index of only 63.62. In other words, this ETF still has room to climb before it is considered “overbought” (when the RSI reaches 70).
As stock market volatility fades and traders embrace risk, Russell 2000 small-cap stocks are usually the first place they run in order to “chase beta” by shopping for high risk/high reward stocks.
Add to the mix the fact that the Federal Reserve is no longer in a hurry to begin the taper of its bond purchases. With fourth quarter GDP expected to get stomped down from an anticipated 3.0% to 2.4% as a result of the mayhem in the Capitol, which accomplished nothing, even the “hawkish” Dallas Federal Reserve President, Richard Fisher, admitted that he is no longer interested in arguing in favor of the taper at the next FOMC monetary policy meeting during the two days before Halloween.
Although Fisher does not get to vote (because he is not an FOMC member), he is allowed to participate in the deliberations. Beyond that, the Wall Street Journal’s Jon Hilsenrath wrote an article on October 17 entitled, “Fed Unlikely to Trim Bond Buying in October”. Case closed.
Bottom line: Earnings appear to be at least decent while the Fed looks set to postpone its taper. The Case/Shiller P/E shows the market to be in dangerous territory and some analysts think the SP500 could be as much as 30% overvalued. All of this adds up to an interesting witch’s brew as Halloween and the “best six months of the year” approach.
By John Nyaradi, Publisher, Wall Street Sector Selector


