
For intraday emini index traders, Wednesday’s Fed meeting delivered a classic lesson in volume price analysis, says Anna Coulling of AnnaCoulling.com.
The example here is from the emini YM one-minute chart, and really proves the point about the power of volume and price. Ahead of the statement, the index traded in a narrow range, with narrow spreads and low volume, and even here, volume is telling its own story, confirming the price congestion phase. Then the news is released, and the market explodes into life, with a surge in volume which soared to an ultra high level. The associated price action is telling its own story—a classic shooting star candle and a sign of weakness in its own right, but when confirmed with the ultra-high volume, adds that three-dimensional view to the chart. Here the price action has surged higher to touch the 15,640 level, before falling equally quickly. This is the power of volume price action at work.
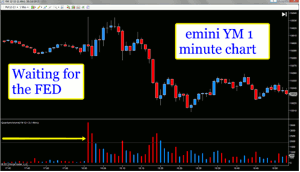
emini YM – 1 minute chart
Click to Enlarge
Having sent a strong signal of weakness, now it is just a question of time, and over the next few minutes, the index tries to move higher, but note the volume on the up candles – it is falling. Another classic sign of weakness and merely confirming the initial signal. Here is an index, moving higher on falling volume, and therefore unlikely to move far. After several minutes the index touches the 15,640 area once again following a sequence of candles which include a doji, a small shooting star, and finally yet another shooting star. A classic example of price resistance coming into play at this level. The market is now extremely weak, and begins to sell off again, with rising volume under the down candles.
Shortly after, the index attempts to rally, but is short lived with a further shooting star candle on high volume, sending a clear signal of more weakness to come. This is duly delivered in abundance, with wide and increasing spread down candles associated with rising and well above average volumes. Finally the index moves into a congestion phase as the shock waves from the news subside, and volumes return to their intra-day levels once again.
Volume price analysis is not new. It has been around for over 100 years and formed the basis of ticker tape reading, from which some of the iconic traders of the past have made their fortunes. For them, volume and price were all they needed to forecast stock price movements, and from which they then produced their own charts. The essential principles, however, remain the same. The only difference is that today, this information is presented electronically on a chart. All we have to do as traders is to interpret the relationship. Assuming of course, that you believe in volume and price as a methodology and just like the market, there are always strongly opposing views!
By Anna Coulling, Professional Trader & Blogger, AnnaCoulling.com


