
Like most anything having to do with trading, there is no silver bullet when it comes to the right the time frame to trade, writes Gabe Velazquez of Online Trading Academy.
As a trading instructor, the question I probably get asked the most is in regards to time frames. Like most anything having to do with trading, there is no silver bullet when it comes to the right the time frame to trade. Instead, a combination of different time frames should be implemented. Additionally, these should be in alignment with a trader’s personal objectives and trading style.
A question I encounter often is one that usually comes from a student that’s setting out to trade for short-term income. The student is ready to trade futures and asks if she should even bother looking at daily charts. Her initial rationale is that since her main objective is to extract money from the markets on a daily basis, the daily charts would be of little benefit to her. The reality is that even if the goal is short-term income, larger time frame charts can help a trader gain a significant edge against the myopic (shortsighted) trader, because larger time frame levels tend to dominate, thus giving the short-term trader an area to anticipate where the market will likely turn.
A recent example of how a daily chart could have benefited a short-term income trader came in the crude oil market. As we can see from the chart below, the crude oil contract traded sideways pretty much the entire month of October, but as we see from the yellow annotated area we had an untested demand zone right below.
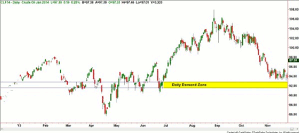
Click to Enlarge
Short-term traders that are versed in conventional technical analysis would look for shorting opportunities based on a break of support (a new low) and the fact that we are forming lower highs and lower lows (a downtrend). Online Trading Academy students, however, would be looking at this chart from an entirely different prospective. They would be poised for a long trade as they have rules that tell them that at daily demand, the odds are higher that the market will rally rather than fall further. As we can see from the next chart, that’s exactly what transpired.
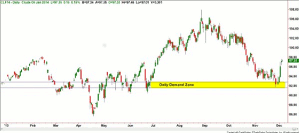
Click to Enlarge
The next step in this process is to step down to a smaller time frame and find a low-risk entry point when crude oil is inside this daily demand level. Incidentally, sometimes we need patience to let levels form. In the next chart, we’re now down to a 60-minute chart, and we see that crude oil spent some time basing before new demand came in. That new demand is the low-risk entry we need to go long.
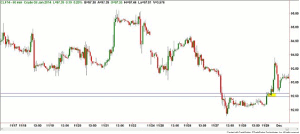
Click to Enlarge
Some traders would never consider taking a long position here because according to the “technicals.” Crude oil is still in a downtrend. OTA students are taught to buy in high quality demand zones (determined by our odds enhancers) and sell at supply.
In the last chart we see the result. I trust that everyone who reads these articles understands that trading is about probability and risk, and although this trade worked very nicely , it could have also been stopped out—and here’s the key—with a very small loss.
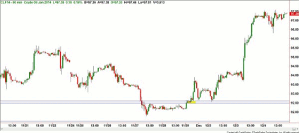
Click to Enlarge
In the final analysis, there is not one single time frame that will give a trader an edge; it’s the right combination of long, intermediate, and short-term time frames that will benefit a trader. The next, and most important point, is that specific levels of supply and demand we see in every time frame will help define whether we want to be long or short. Defining levels in different time frames also help us determine the type of risk versus reward associated with every trade, because without this information we essentially don’t have a strategy. And without a strategy, well…we’re just gambling.
By Gabe Velazquez, Instructor, Online Trading Academy


