Wouldn’t it be nice if there was a crystal ball that told you where the next market turn and market move would be, asks Sam Seiden of Online Trading Academy?
Imagine looking into the crystal ball one day and it told you the S&P was about to turn lower in the 1803.50-1805 range and likely to fall 40 points quickly. If I told you that you had access to the same crystal ball that gave us this information the other day, you would not believe. However, that’s because you have known a crystal ball as a round, magical, fortune-telling fairy tale that doesn’t exist. The real one has been in front of you all along; you just didn’t see it and likely don’t know how to read it. The crystal ball is your price charts; let me share the needed insight with you to help you learn how to use it to reap the rewards it provides.
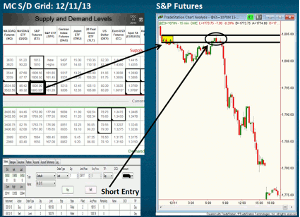
To share this insight, let’s go over a shorting opportunity in the S&P that was offered on the Mastermind Community (MC) Supply/Demand (SD) grid from last week. Specifically, we will look at the two key pieces of information on the price chart that gave us that opportunity. At 5:30 am CST, December 11, I was delivering a live analysis session in the MC XLT. We were actually building the SD grid together; I do this with the group twice a month. The S&P had a small supply level on the 15-minute chart (yellow box) and price was sitting below it. Structure-wise, that was a key supply level as it had a few odds enhancers going for it. First, there was a nice initial decline from the level. Second, there was not too much trading that took place at the level suggesting a strong supply and demand imbalance at the level. Next, it was a “fresh” supply level meaning lots of supply. I determined the level was solid and worthy of the MC SD grid so it was added as the first supply area for that trading session, where banks had many unfilled sell orders. A couple hours later, price rallied up to our supply level but where would it go from there and how can we determine that in advance with a very high degree of accuracy?
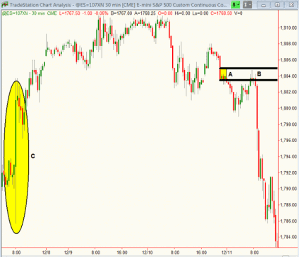
For that information, we need to look at the chart below. “A” is our supply level and “B” is when price rallied back to our level for a short entry. “C” is what we need to spend time on now as that was “key” information for us. We spent time going over the yellow shaded area “C” for quite some time, two hours before price rallied to our supply level. Notice all the price action in the yellow shaded area, which represents the price action below our supply level. Remember, when we sell short, we need to make sure there is no significant demand close to our shorting area. We want to make sure the price level where banks and institutions are buying is significantly lower.
The charts (crystal ball) do an excellent job of giving us this information. In that yellow shaded area “C,” there is nothing that represents significant demand according to our rules. Translation: There is nothing to stop price from falling and falling far. This was also represented on the supply/demand grid if you look at the S&P demand level on the grid. Notice it was at 1772. With our grid supply at 1803.50 and our grid demand at 1772, that tells us there is strong potential for price to decline, fast and far. Typically, the distance between our first demand and supply levels is not that far. This is also how we determine whether volatility is going to be high or low in the near future. Price reached our supply and fell strong, as the chart suggested it would. Did I mention how important this area “C” was? Very!
What is key is to focus 100% on the significant (bank) buy and sell orders and nothing else. To summarize, we need to look for two things on the chart:
1) Key Supply and Demand Levels: Area “A” on the chart. This is where price always changes direction, market turning points.
2) Pockets of Very Little Supply and Demand: “C,” the yellow shaded area, didn’t have any price levels in it where there was a significant supply and demand imbalance. This is where price moves with little change in direction.
While my fear is that what I am suggesting sounds too simple, please don’t underestimate the power of simple. It’s all about orders, orders, orders… Focus on where they are and equally important, where they are not, and that is the key to using your crystal ball to predict market turns and market moves with a very high degree of accuracy.
By Sam Seiden, Chief Education, Products, and Services Officer, Online Trading Academy


