John Bougearel of Commodity Trading Advisor shares the results of three studies that will signal when a market top is imminent.
The Dow Jones has rallied for five consecutive years and its 28% gain in 2013 was its best year ever since 2003 and 1998. An investor might rightly characterize this as the Alfred E. Neuman market. "What, Me Worry?"
However, research by Debondt and Thayer, et.al. show that strong trends over the prior three to five years tend to reverse. Moreover, from a pattern perspective, the behavioral attributes of the Dow Jones in 2013-14 is exhibiting strong correlation to the Jan. 14, 2000, and Jan. 11, 1973, peaks in the Dow Jones. The behavioral correlation lend credence to the possibility of a mean reversion in and of itself. Another form of mean reversion for investors to consider is the shift in Fed policy to reduce asset purchases beginning in this month. The Fed may fail to remove asset purchases entirely, but they are first going to give this “taper” business the old college try.
Intriguingly, according to from Rogers Int’l Commodity Fund RICI, annual returns of commodities have been negative for three consecutive years from 2011 through 2013. Since 1970, RICI’s dataset shows that the annualized returns of commodities have never been negative for three consecutive years. So a mean reversion is likely in the commodity sector as well. And despite weakness of commodities in recent years, commodities have historically offered investors attractive long-term returns. Mean reversion strategies may not be a bad way for investors to go in 2014.
The question is: when will be the optimal time to make a mean reversion shift? While we don’t quite know the answer to when the US stock market will crest, preliminary evidence suggests the most likely time frame will be near the Jan. 10, 2014, NFP report on Friday, or late January, when Yellen chairs her first FOMC meeting. Since we don’t know exactly when the crest will occur, it is perhaps best to identify when the stock market will begin to signal weakness from short-term trading signals.
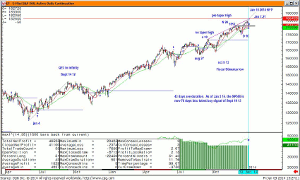
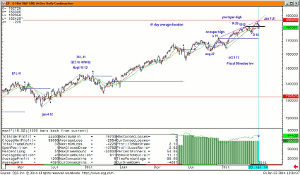
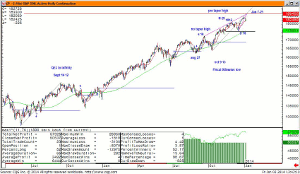
The following will illustrate three short-term simple moving average crossover SMAX trading signals for the SP500 that have proved to be fairly robust over a statistically significant amount of time. The first chart will be the 14/38 day SMAX. The second will be the 18/32 SMAX. The third will be the 11/76 SMAX.
This trade optimization study has a total trade count of 35. The average duration is 43 days. It has produced 51% winners and shows a 2.15 to 1 profit/loss ratio. The latest buy signal was elected on Sept. 19, 2013, and we are now 76 days into the latest buy signal. This signal may be a bit long in the tooth, but until the 14 closes below the 38-day average near 1800, this signal will stay long.
This trade optimization study has a total trade count of 37. The average duration is 41 days. It has produced 54% winners and shows a 2 to 1 profit/loss ratio. The latest buy signal was elected on Sept. 20, 2013, and we are now 75 days into the latest buy signal. This signal will stay long until the 18 closes below the 38-day average near 1803.
This will produce a sell signal a tad earlier than the 14/38.
This trade optimization study has a total trade count of 23—statistically less than the previous two, though all three trade optimization studies look back 1500 bars, which is close to six years and this encompasses the entire bull market campaign from March 2009 and then some. The average duration is 65 days. It has produced 52% winners and boasts a profit/loss ratio that is close to 4 to 1.
The latest buy signal was elected on August 29, 2013, and we are now 91 days into the latest buy signal. This signal will stay long until the 11-day average closes below the 76-day average now sloping through 1758 near 1803. The rate of change on the 76-day average is close to $2 a day.
It will take several weeks for this trade optimization to produce a sell signal. And the last two sell signals were extremely short-lived, and stopped out at a small loss in a matter of days. Makes one wonder what the average duration of the long signals are on this system.
The 11/76 is almost more of a medium-term signal.
By John Bougearel of Commodity Trading Advisor


