One of the greatest challenges as a trader is to determine whether a trend in motion is likely to continue or reverse, says Corey Rosenbloom of AfraidToTrade.com.
Reversing a trend is a process, similar to reversing a freight train, and a stock tends to signal reversals we can see on a price chart.
Let’s take a closer look at four of these steps and apply these lessons to similar situations.
While stocks in a trend tend to continue trading in the direction of the trend, no trend can last forever. Aggressive traders seek to find the spot where odds are greatest to play a potential trend reversal with the lowest risk opportunity.
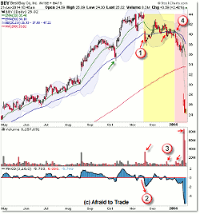
I wanted to highlight four specific steps Best Buy (BBY) shares took ahead of the recent breakdown:
1. Breakdown (probe) Under 50-day EMA
In a trend, we look to the rising 20- and 50-day exponential moving averages to provide buy-signals (off support) for retracement entries into a trending stock.
A probe or break under the 50-day EMA can be an initial sign that “all is not well” with a mature trend.
2. “Kick-Off”
This is a lesser-known concept based on work by Richard Wyckoff. Notice the visual new “spike” momentum low on the 3/10 oscillator (which also would show up in a rate of change indicator) when price was pushing down from the $4.00 per share new high.
This is a “hidden” sign of weakness where price shows a simple retracement yet momentum—and the volume spike—suggests that something else (more bearish) is going on behind the scenes.
3. Distribution Volume
We look to volume—like momentum—to confirm a trend in motion. A price in a rising trend should be met with rising volume (particularly on up-swings in price) and momentum.
If we see lengthy divergences (lower volume with higher price) or a situation where volume increases during sell-off (retracement) phases, then this could be a sign of broader Distribution of Shares. It suggests that buying pressure is waning (decreasing) while selling pressure is increasing.
Notice the small volume divergence in October along with the red spikes in sell volume particularly after the November “kick-off.”
4. Bearish EMA Cross-Under
Similar to the price break (and close) under the 50-day EMA, a sustained movement under the 50-day EMA will result in a negative or bearish cross-under of the 20/50 EMAs.
Best Buy shares started 2014 with such a bearish cross-under ahead of the recent reversal (gap).
Keep in mind that these four factors developed on the price chart ahead of the downside gap. At a minimum, they were warning signs to reduce bullish positions (we want to own stocks that are strong and getting stronger, not weaker).
While these four factors serve as helpful guidelines, let me point out two additional “pure price” factors:
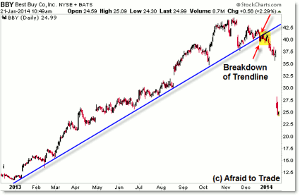
In late December, Best Buy shares broke and closed under a longer-term rising price trendline (blue).
Similar to moving averages (indicators), we can hand-draw trendlines that connect as many price lows as possible (they don’t have to be perfect).
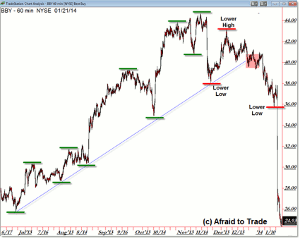
Finally, we can look to “price structure” itself which directly compares price highs and lows as they “build” a trend:
To analyze trend structure, simply label key swing highs and key swing lows as price moves in a trend.
An uptrend is active as long as price continues to develop higher swing highs and higher swing lows.
A trend is thus reversed when a series of lower lows and lower highs develops. Keep in mind that it takes a lower low, lower high, and a break of the newly established lower low to reverse trend structure.
As traders, we learn from patterns (and situations like this) that tend to repeat. Nothing is ever guaranteed, and we’re always assessing the probability, not certainty of events that take place on the price charts.
By Corey Rosen bloom, CMT, Trader and Blogger, AfraidToTrade.com


