
First published in 1934, many of the 20 trading guidelines from Richard Donchian are as relevant today as they were during the golden age of technical analysis, writes the staff of stockcharts.com.
Considered by many as the father of trend following, Richard Donchian developed one of the first trend-following systems based on two different moving averages, which were cutting edge in the early ‘30s. Based on his experiences over time, Donchian developed 20 trading guidelines split into two groups: general and technical. The guidelines shown below have been paraphrased for a clearer explanation.
11 General Guidelines
1. Be careful buying when the crowd is excessively bullish or selling when the crowd is excessively bearish. Even when the crowd is correct, excessive sentiment in one direction or another can delay a move.
2. When prices trade in a narrow range with little volatility, look for a volume increase to confirm the direction of the next move. Subsequent strength on higher volume is bullish, while subsequent weakness on higher volume is bearish.
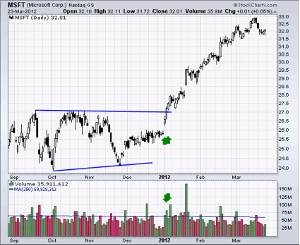
Click to Enlarge
3. Let your profits run and cut your losses short. This guideline overrides any other guideline.
4. Trade in smaller amounts during times of uncertainty. Trading losses and whipsaws can be reduced by focusing on solid setups and robust signals.
5. Do not chase a position after a three-day move. Wait for a one-day reversal to improve the risk-reward ratio.
6. Use a stop-loss to limit losses and protect accrued profits. Stop-losses should be based on the trading pattern at work. A triangle pattern will have a different stop-loss structure than a rising wedge or head-and-shoulders pattern.
7. Due to the law of percentages, long positions should be larger than short positions during a broad uptrend. This assumes that the upswings will be larger than the downswings as a series of rising peaks and troughs evolves. A short position on a decline from 50 to 40 would produce a 20% profit, but a long position on an advance from 40 to 50 would produce a 25% profit. The percentage gain on advances will be greater and the trading amount should also be greater.
8. Use limit orders when initiating a position. Use market orders when closing a position.
9. Buy securities that are in uptrends and show relative strength. Sell securities that are in downtrends and show relative weakness. These two guidelines are subject to all other guidelines.
10. A broad market advance is more likely to continue when transportation stocks lead (Dow Transports). A broad market advance is suspect when transportation stocks lag.
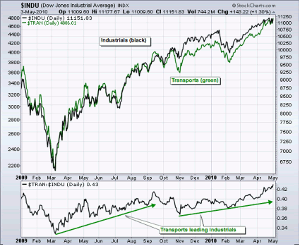
Click to Enlarge
11. A security's capitalization, its activity level in the marketplace, and its trading characteristics are just as important as its fundamentals. (The interpretation of this guideline is rather difficult because it is unclear what Donchian means with "capitalization"). [Editor’s Note: it would appear to mean liquidity here]
Nine Technical Guidelines
12. A consolidation or sideways trading range after an initial advance often leads to another advance of equal proportions. After this second advance, chartists can expect a counter move and decline back towards the consolidation. Similarly, a consolidation or sideways trading range after an initial decline often leads to another decline of equal proportions. After this second decline, chartists can expect a counter move and advance back towards the consolidation.
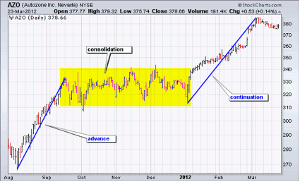
Click to Enlarge
NEXT PAGE: 8 More Donchian Rules to Live By
|pagebreak|13. A long sideways consolidation after an advance marks future resistance. Expect resistance or a bearish reversal when prices decline and then return to this level. A long sideways consolidation after a decline marks future support. Expect support or a bullish reversal when prices advance and then return to this level.
14. Look for buying opportunities when prices decline to a trendline on average or low volume. Conversely, look for selling opportunities when prices advance to a trendline on average or low volume. Be careful if prices stall around the trendline (hug) or if the trendline has been touched too often.
15. Prepare for a bearish trendline break when prices decline to a rising trendline, fail to bounce and subsequently crawl along the trendline. Prepare for a bullish trendline break when prices advance to a falling trendline, hold most of their gains and crawl along the trendline. Repeated bumping of a trendline also increases the chances of a break.
16. Major trendlines define the longer trend. Minor trendlines define the shorter trend. When prices are above a major trendline (rising), use minor trendlines (falling) to define short pullbacks and generate buy signals with upside breaks. When prices are below a major trendline (falling), use minor trendlines (rising) to define short bounces and generate sell signals with downside breaks.
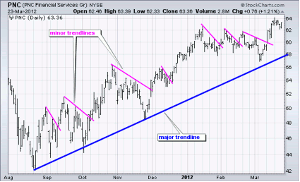
Click to Enlarge
17. Triangles are usually broken on the flat side. This means an ascending triangle is usually broken with an upside breakout, while a descending triangle is usually broken to the downside. Chartists must look for other clues to determine if a triangle signals accumulation or distribution.
18. Look for a volume climax to signal the end of a long move. An extended advance sometimes ends with a volume surge that marks a blow-off . Conversely, an extended decline sometimes ends with a volume surge that marks a selling climax.
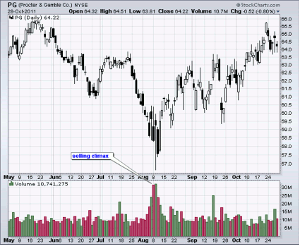
Click to Enlarge
19. Not all gaps are filled. Breakaway gaps signal the start of a new trend and are not filled. Continuation gaps mark a continuation of the existing trend and are not filled. Exhaustion gaps mark a trend reversal and are filled. Chartists should not count on a gap being filled unless they can determine what kind of gap it is, which is easier said than done.
20. During an advance, initiate or add to long positions after a one day decline, no matter how small the decline and especially when the decline is on lower volume. During a decline, initiate or add to short positions after a one-day advance, no matter how big the bounce and especially if the bounce is on lower volume.
Conclusions
At least three themes emerge from these rules. First, direction of the underlying trend determines position preference. Chartists should focus on long positions during an uptrend and short positions during a downtrend. Second, volume plays an important part in the analysis process. Price moves in the direction of the bigger trend should be on higher volume, while counter trend moves should be on lower volume. However, note that volume climaxes can mark the end of an extended move. Third, trading ranges and consolidations are important chart patterns. Long consolidations can mark reversals and future support or resistance levels. Short consolidations often mark a rest in the ongoing trend.
By the Staff of stockcharts.com


