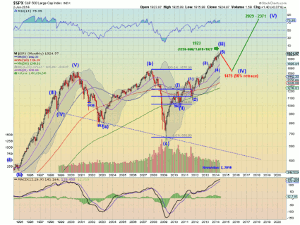
Another run of all-time highs in the major indices continues to make traders jumpy and wondering whether now is the time to sell, but Greg Harmon of Dragonfly Capital, makes the case for why they shouldn’t.
I have been using this monthly Elliott Wave chart on the S&P 500 as a guide for nearly four years now. Pulling it out occasionally to remind traders of the big picture and how far the trend can run.
Back in November 2010, I measured a 161.8% extension of the first leg higher after the financial crisis to get a possible target of 1923 for the S&P 500. This was a high-level analysis. It has now hit that target. So is it time to sell everything? No, not yet. Keeping it high level here are a few reasons why.
1. The market is still rising. Why would you sell stocks that are rising? You should already have stops in place. Just continue to honor them.
2. The 161.8% extension is just a guideline. Elliott Wave enthusiasts know that Wave (III) is usually the longest, but there is no rule that it cannot be 200% of Wave (I) or even more.
3. Wave (IV) was drawn as a 50% pullback of Wave (III), but this is likely wrong. Enthusiasts again would know that Wave (II) and Wave (IV) tend to have different characteristics. If one is corrective the other tends to be flat. So as Wave (II) was corrective in this case, Wave (IV) would be expected to be flat.
Elliot Wave would suggest that when the end of Wave (III) is reached, then we can expect some sideways action for a while before a Wave (V) thrust higher. None of this is a guarantee, but do you really want to just blindly sell now?
There are many other features here that you could use to analyze this chart. But keeping it simple and high level, it is not time to sell yet.
By Greg Harmon of Dragonfly Capital


