Springheel Jack of SharePlanner.com shares what he sees on the charts and believes that, if current levels are broken and the target at 1884 is reached, then more significant downside targets may open up.
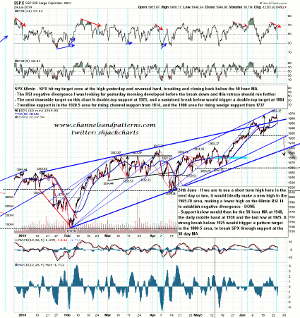
SPX made my target area at 1965-70 and rejected hard there. A candidate significant high for a 10%+ correction is in place but we're going to need to see some follow through here first to open up the obvious downside targets for that correction. On the SPX 60min chart, the 50-hour MA was broken near the close Tuesday and SPX closed below it. I'd like to see that established as resistance Wednesay and after that any significant break back above it would be a warning that this retracement might be over.
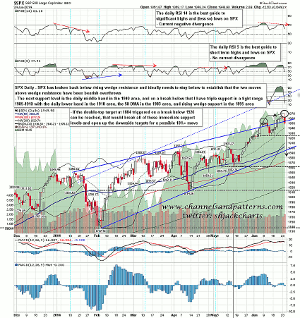
Assuming we saw some follow through Wednesday, the next serious support is at the daily middle bollinger band, currently at 1940, and if the bears are to have a shot at a decent retracement here, then it will need to break. That would open up a test of double top support at 1926, and a sustained break below that would trigger a double-top target at 1884. If that target were to be made, that would break a cluster of important support levels between 1895-1910, with the daily lower band at 1910, the 50 DMA at 1903, and rising wedge support from 1737 currently in the 1895 area. If these levels are broken and the target at 1884 is reached then more significant downside targets would open up.
SPX Daily Chart:
On the SPX 60min chart, the trendline support levels are rising channel support from 1814, currently in the 1915 area, and rising wedge support from 1737, currently in the 1937 area. Bears need to hold the 50-hour MA above and aim to break down from this wedge.
SPX 60Min Chart:
The 1884 double top target is supported by the weekly middle bollinger band, currently at 1882. Another thing worth noting here is the negative divergence on the weekly RSI 5. This needs to persist into the close on Friday, but if it does then historically I'd expect the weekly RSI 5 to decline to at least the 50 level. That would suggest at least a test of the 1900 area for this decline, and most likely more.
SPX Weekly Chart:


