Traders of crude oil have noticed the increase in volatility and intraday gaps with reversals as of late, so technician Corey Rosenbloom of AfraidToTrade.com charts the movement over the past few sessions and teaches that sometimes the best trade to make…is no trade at all.
If you’re a trader or follower of crude oil, you’ve noticed the increased volatility and intraday gaps with reversals over the last few sessions.
Let’s take a look at what’s happened and where we are now in the market (the lesson goes beyond crude oil).
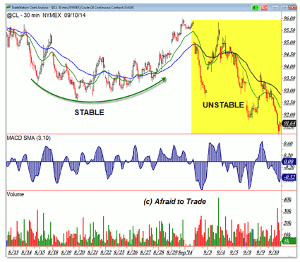
We’ll start with the transition from stable to unstable:
Positive Divergences and a “Rounded Reversal” price pattern successfully led to a retest of the prior price high as oil moved up from the $93.00 level toward the initial target into $96.00.
However, that’s where price devolved (changed) from stable to unstable as you can see in the highlight.
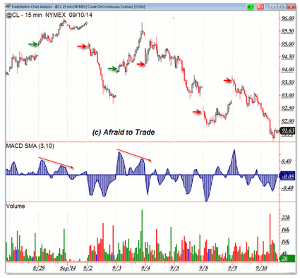
The chart below specifically highlights what went wrong with price (multiple gaps):
In fact, every single day in September (except the 5th) has resulted in a relatively large overnight gap.
There isn’t a pattern to the gaps—sometimes price continues trading in the direction of the gap (impulse) to form a trend day (August 29 and September 3) while other days saw a gap fill and instant reversal (September 4, 8, and 9).
Nevertheless, the volatility—or instability (rapid, seemingly random movement)—has resulted either in instant profits or more likely instant losses for many Crude Oil traders.
The lesson here is that we should participate or trade in relatively stable price movement (that which follows a pattern or shows lower degree of gappiness) and protect our accounts (stand aside) when markets devolve into instability and show multiple gaps without a clear pattern.
Part of your success as a trader will come from your ability to recognize periods in the market when you shouldn’t trade (when odds don’t favor success).
By Corey Rosenbloom, CMT, Trader and Blogger, AfraidToTrade.com


