
The S&P 500 Index and Dow Jones Industrial Average are both trading below levels hit in January of last year, so this is either one of the longer market consolidations in memory… or one of the more important developing tops in Wall Street history, cautions Jim Stack, money manager, market historian and editor of InvesTech Research.
At almost 10 years of age, this is the second longest U.S. economic expansion. Long expansions create high debt levels and overheated (overvalued) stock markets. And history has shown that bear markets which follow larger bull markets can be particularly nasty.
Almost every bear market of the past 86 years has taken back or repossessed close to one-half or more of the previous bull market’s gain (the only exception was in 1956).
Based on today’s bull market that started in March 2009 at DJIA 6547, that could easily mean losses of -40% or more in the next downturn. This is not a low-risk market environment today.
With the impressive rally in 2019, investors are again viewing the stock market through rose-colored glasses, as their anguish from last December’s deep (and swift!) correction fades from recent memory. Although many have enjoyed this year’s gains, the market really hasn’t “gone anywhere” for the past year and a half.
Blue chip indexes have only edged slightly higher than previous peaks dating back to January 2018. The weight of evidence continues to suggest this bull market’s runway might stretch a bit longer, but the road ahead may be rocky, especially given the time of year we are entering.
The widely known adage, “Sell in May and Go Away,” is based on past market trends and is one of the most popular recurring themes on Wall Street. Historically, the winter period from November 1 through April 30 is the prime time to be invested in stocks.
Since 1960, this 6-month period has seen an average return of 7.8% in the S&P 500. Conversely, the summer doldrums often weigh on the stock market from May 1 through October 31. Over the same 59 years, the average return for the May through October period is only 2%.
Arguments abound about the value of advice provided by the “Sell in May” adage, and this debate almost always finds its way into the media.
The present bull market has lasted more than 10 years and risen over 335%, and the stellar year-to-date gain has further fueled a positive market outlook as the norm. That could explain why media pundits are not giving much credence to the annual “Sell in May” debate this time around.
Yet looking back, the evidence of a strong seasonal shift in the majority of years is quite compelling. Shown below is a graph in which two investors both start in 1960 with a $10,000 nest egg and invest during opposing seasons.
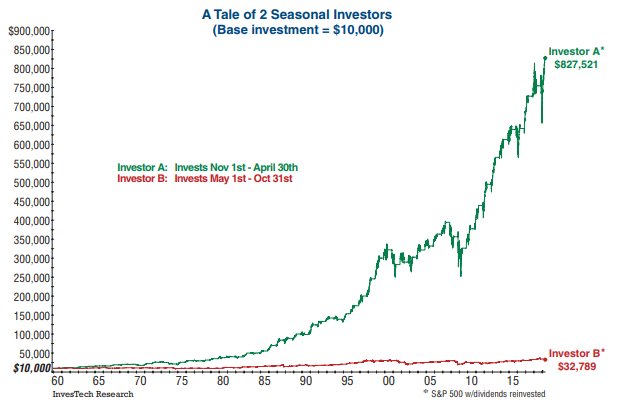
Investor A buys an S&P 500 index fund on November 1 and moves to cash on April 30, remaining in cash through the summer. Investor B does the opposite, investing in the market only from May 1 through October 31.
The outcomes couldn’t be more different! Investor B’s nest egg would have slightly more than tripled by now, ending with $32,789. Meanwhile, Investor A’s $10,000 would have compounded to over $827,000.
Of course, the market doesn’t always ratchet down from high gear in early May, and winters aren’t always winners, while summers aren’t always losers.
Since 1960, nearly a quarter of the November-April periods have ended with negative S&P 500 returns, and four years saw double-digit winter losses (all were associated with major bear markets).
On the other hand, summers have seen at least mildly positive returns the majority of time, with double-digit gains from May-October just as likely to occur as double-digit losses.
Practically speaking, it wouldn’t be prudent to sell all stock holdings in May and move to cash. The average 2% return, although meager, is important to the compounding effects of long-term performance.
There are adjustments, however, that can be made to help capture remaining upside in the stock market and protect your portfolio.
Sector leadership tends to shift significantly as the market moves from the November through April period into the summer months. The winter period (Nov-Apr) favors cyclical growth stocks, particularly as a tailwind is provided by the holiday shopping season.
On average, Consumer Discretionary, Materials, and Industrials all saw double-digit returns. Industrials tend to kick into overdrive during the winter, and this sector has been one of the more consistent seasonal leaders, beating the S&P 500 Index 76% of the time from November through April.
During the summer period (May-Oct), the market often takes on a more defensive tone as the cyclical sectors move to the bottom of the list (red arrows) and the winter laggards take the lead (green arrows).
Health Care and Consumer Staples have been the most resilient sectors in the summer months with average returns exceeding 5%, beating the market approximately 60% of the time.
Likewise, the Technology sector also does well (highest batting average), as industry trends have moved to more stable cash flows based on recurring revenues.
Conversely, Industrials and Materials are consistently weak and have the lowest batting averages, leading the summer market only 17% and 35% of the time, respectively.
Just as we don’t advocate selling all holdings in May and moving to cash, it also wouldn’t be prudent to sell all holdings in the cyclical sectors when the summer season starts.
However, adjustments can be made to more closely align your investments with the Model Fund Portfolio keeping the following in mind:
• Maintain a healthy balance of defensive sectors that hold up well in the summer and reduce those that don’t.
• Consider trimming cyclical positions (or any other stocks) that have run up and become significantly overvalued.
A little housekeeping now could prove beneficial over the next several months.
As we’ve commonly stated — navigating mature bull markets is never easy. Very often, reliable warning flags will appear at times throughout an extended economic expansion. That, of course, makes it alluring to turn too cautious too soon and leave valuable profits on the table.
At the same time, however, one should never try to squeeze the last gains out of a bull market. And it’s never fun to ride through the first stages of a severe bear market in an over-invested position that creates losses which are intolerable.
The sharp sell-off in December was a mere taste of what the next bear market likely has in store for buy-and-hold investors.
In a booming economy with unemployment near record lows, it undoubtedly seems odd to most investors that stocks are not roaring higher. But there are underlying forces at work that are pressuring corporate profit margins and raising debt to dangerous levels.
Macroeconomic evidence is seemingly resilient, but technical concerns remain… It’s difficult to argue against the Leading Economic Index which is at a new high, or unemployment claims which recently dropped to new lows.
Altogether, such evidence suggests that a recession is not on the foreseeable horizon. Yet the Federal Reserve’s own yield-spread model shows a 28% chance of recession in the next 12 months.
And more importantly, consumer confidence is at lofty levels reminiscent of major market tops of the past 50 years. Extraordinarily high confidence leaves a lot of room for disappointment.
Meanwhile, it is the divergence in margin debt and in small-cap and transportation stocks that has our more immediate attention. The first is a sign that speculators may be losing confidence in this market’s outlook. And the second (weakness in small-cap and transportation stocks) is a potential sign of a market top.
All major market tops of the past 59 years were preceded by peaks in one or more of these three bellwether indexes: the interest rate-sensitive Dow Jones Utility Average, the economically sensitive Dow Jones Transportation Average, and/or the small-cap Russell 2000 Index.
This doesn’t guarantee a bear market is at hand, but it does warrant a more defensive approach and allocation if you are a “safety-first” investor. Bottom line, the next six months are vital to this market’s outlook.
If this 16-month consolidation is the “pause that refreshes” then we should see a rebound in margin debt and increased strength. That could signal the bull market extending well into 2020 before trouble hits.
On the other hand, we will not be surprised if warning flags increase on both the technical and leading economic side over the next 4-6 months.
The next bear market is lurking out there somewhere in the darkness, and we want to be among the first to see definitive warning signs. Patience is always a virtue to a seasoned investor, but when navigating a mature bull market it becomes an absolute necessity.


