
Our theory is that the stock market is now hugely driven by algorithmic trading to such an extent that traditional analysis, especially value oriented — must fail, cautions Alan Newman, editor of Crosscurrents.
In fact, we have shown twice before with charts and data, that dollar trading volume generated by individual investors — human beings — has not increased in over 19 years.
In April 2019 we first pointed out that algorithmic trading amounted to $71.5 trillion, accounting for the entire increase in total dollar trading volume (DTV) from the peak in March 2000 through the end of 2018.
At the time, we said, "Think about that. Over nearly two decades, the last ten years of which have been a bull market, trading has been totally dominated by methodologies that for the most part, have nothing to do with the prospects of individual stocks. Nothing like this has ever before occurred."
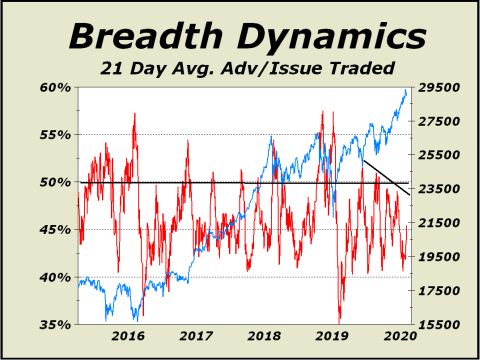
Note the chart clearly shows a dramatic declining trend in the number of issues traded daily on the NYSE. The peaks and valleys would logically be associated with bull market peaks and bear market lows, since public interest has always been the principle effect upon prices.
And when more stocks trade, prices are typically going to rise with the increased interest. However, interest is declining! And unlike before, as interest declines, prices are still rising. This is an astonishing development.
Again, human participation has not increased in over 19 years. Our interpretation is that the most recent rally in stocks is a veritable blowoff.
Our Demand & Supply chart below is, well, astonishing. We believe the formula for this chart works well to illustrate demand and supply, certainly on a relative basis. Note prior bottoms equating to net supply occurred at bear market bottoms and would typically connote a weak environment.
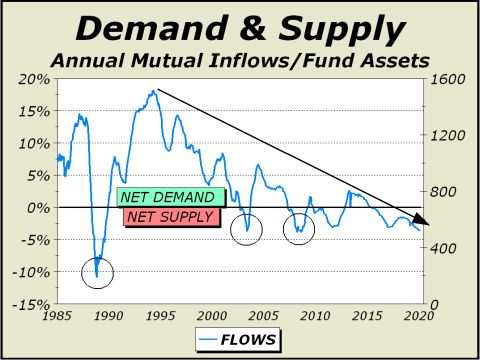
Precisely the opposite occurs with peak in net demand, bull market peaks. However, the current period is so strange! Demand has been "negative" since February 2015! Nevertheless, the Dow is 10,000 points higher and the S&P 500 is up more than 56%!
Despite the evidence of a blowoff, breadth is about as punk as we have seen for a long, long time. Our moving average represents about one month worth of trading. Despite the long teem lived bull move since the corrective bottom of very early 2019, we see a very disturbing negative divergence.
Simply put, whatever we see of rising prices is continually confined to a smaller and smaller group of stocks. This is typical of imminent trend change.
If a correction is imminent, right now fits on so many levels. Investment Adviser Bulls as reported by Investor's Intelligence is now at 59.4%, the highest since October 8, 2018. The Dow Industrials immediately caved and collapsed by 18% in only eleven weeks.


