
Despite the bearish headlines, the US stock market was surprisingly strong. But what does that mean heading into June? MoneyShow.com Senior Editor Tom Aspray explains.
Last week’s financial headlines may have caused many stock investors to run for the exits, as there was very little to make one think that stocks could move higher. Here is a sampling:
- Demand For Durable Goods Falls the Most in 6 Months
- Countries Urged To Raise Rates
- Goldman Says Brent Will Hit $130
- Revenue Slide Dents Banks’ Recovery
- Draghi Warns on Global Recovery
- Fears of Debt Contagion Return to Eurozone
- UK Lenders Face Rating Downgrade
- Steep Quarterly Drop For Home Prices
Despite the concerns over debt contagion, a double dip in the economy, and slower growth in China, the US stock market was surprisingly strong. The early-morning declines on Wednesday and Thursday were met with good demand.
Therefore, even though the major averages made new correction lows, the market had plenty of reasons to drop more sharply. For most of the week, Tuesday’s headline from the Financial Times, “Investors swept up in wave of bearishness,” said it all.
So even though the stock market was not as strong as I had forecast last week, I am sure most were surprised that it closed higher. Sentiment measures continue to get more negative, with only 25% bullish in a recent AAII survey. This is the lowest reading since last summer.
Last week’s pending home sales dropped 11%—but new home sales were stronger than expected, giving some home builders a boost. On Tuesday, we get more housing data, as the S&P Case-Shiller price index will be released along with consumer-confidence numbers.
Of course, this is another jobs week, with a preliminary reading Wednesday from the ADP Employment Report, followed by jobless claims Thursday and the monthly employment report on Friday. Also out Wednesday is the ISM Manufacturing Index, with the ISM Non-Manufacturing following on Friday.
As the headlines show, there are still plenty of problems facing the Eurozone, and the Strauss-Kahn scandal has not helped—the BRIC countries, among others, are not in favor of a new IMF head from the Eurozone. Also, as my colleague Jim Jubak suggests, “Another Quick Fix For Greece” is likely.
Euro investors have also been moving away from risk, as the yields on German debt have dropped 3%, matching similar yield declines in both the UK and the US. Nevertheless, the DJ STOXX Europe 600 was able to close the week well above the lows, as it tested strong support in the 272 to 274 area early in the week.
Commodity prices have bounced nicely from the mid-month lows, and the strength in copper may be a sign that the economy is really stronger than most expect. Crude oil has bounced from the recent lows, but is now hitting first strong resistance. Technically, this rally looks as though it will be followed by a further decline.
NEXT: WHAT TO WATCH
|pagebreak|WHAT TO WATCH
As I noted in more detail before Friday’s opening, the technical and sentiment picture for the stock market had improved. The positive action Friday supports this view, even though the major averages closed below their best levels.
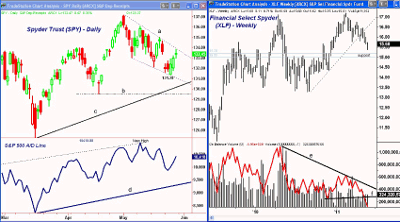
Click to Enlarge
S&P 500
The Spyder Trust (SPY) tested its downtrend (line a) on Friday, and still has strong resistance at $135.36. A daily close above this level should confirm that the correction is over. A test of the May 2 highs at $137.18, if not a move to the $138.50 area, is still a distinct possibility.
The low for SPY at $131.38 is now the critical level, with the daily uptrend (line c) now at $130.50. If this level is violated, the April lows are at $129.51 (line b).
The S&P 500 A/D line has turned up, and is very close to breaking its downtrend. It did make new highs in May, and is still well above long term support (line d).
Dow Industrials
The Diamonds Trust (DIA) also appears to have completed a short-term bottom, but is slightly lagging the SPY. DIA has just filled the gap from last Monday’s opening. There is still a strong band of resistance in the $126.50 to $127.50 area.
The support level to watch now for DIA is $122.80, while the April low and major support follows at $120.65.
Dow Transportations
The Dow Transportation Index held above the prior week’s low at 5,311, and did close last week higher.
A close above 5,500 is needed to complete the correction and signal a rally to new highs in the 5,650 to 5,700 area.
If one of the other major averages is able to exceed the May highs, and the Transports fail to make a new high, it would be a warning sign.
Nasdaq-100
I have been looking for the PowerShares QQQ Trust (QQQ) to lead the market on the next rally, but it has continued to lag. It will now take a much stronger rally for QQQ to take over leadership.
The first hurdle is the resistance in the $58.50 area with major at $59.34 area.
The down gap last Monday violated the support in the $57 area as QQQ hit a low of $56.47 which weakened the short term outlook. There is now important support below $56.
Russell 2000
The iShares Russell 2000 Trust (IWM) has concerned me for several months, and last week it dropped below the April lows. This is a further sign of weakness, and as I noted several weeks ago the A/D line on the Russell 2000 failed to make a new high with prices in April.
The rebound in IWM is likely to fail in the $85 to $85.50 area, even if the SPY makes new highs. Therefore, the current rally should be used as an opportunity to move out of both small and mid-cap stocks.
Once below the recent lows at $80.76, the next major support is in the $77.50 to $78 area.
NEXT: Sector Focus
|pagebreak|Sector Focus
- The Financial Select Spyder (XLF) topped out early in the year, and is now getting close to the stronger support in the $15 to $15.20 area. The weekly chart allows for an eventual decline to between $14 and $14.50. The weekly OBV is in a strong downtrend (line e), and has plunged through support (line f). On a short-term basis, a rally is likely, but it should fail below the $16 area.
- As I mentioned last week, I felt that both the Consumer Staples Select Sector SPDR (XLP) and the Health Care Select Sector SPDR (XLV) were a bit crowed. Both had reached their weekly starc+ bands, which indicated it was a high-risk time to buy. Both ETFs did correct last week, dropping 2.4% and 3.3% from their highs. Though it is possible they will both resume their uptrend immediately, there was quite heavy selling on the correction.
- For more on the starc bands, see Buy, Sell, or Wait: A Way to Decide.
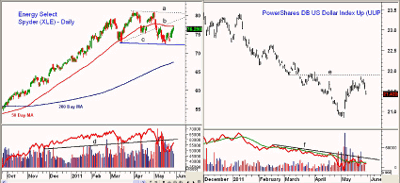
Click to Enlarge
- The Energy Select Spyder (XLE) still appears to have completed a weekly top formation, as it has just rallied back to its 50-day MA at $77. There is additional resistance at $78.20 (line b) and then major levels at $80 to $81. The daily OBV shows the heavy selling that completed the top formation, as support (line d) was broken. If XLE drops below the recent lows at $72.28 (line c), it could decline to the 200-day MA at $68.
Oil
The July crude-oil contract closed last week just above $100, as so far the resistance in the $102 area has stalled the rally. There is further resistance in the $104.50 to $105 area, which may be tested before the rebound is over. A further rebound in crude could help take XLE back to stronger resistance.
There is good support now in the $97.50 to $98 area, and then stronger levels at $95.30, which was the recent low.
Natural gas may have completed a significant bottom, as after dropping (on bearish inventory numbers), it reversed to the upside and closed higher. For more, see “Is Natural Gas Bottoming?”
US Dollar
The rally in the PowerShares DB US Dollar UP ETF (UUP) stalled below resistance at $21.90 (line e) before turning lower. Heavier selling late in the week took UUP close to the next support at $21.35.
This level is likely to be broken through to further support at $21.10 to $20.84. The daily OBV failed to break its downtrend on the rally (line f), and is close to new lows.
Recent CME data shows that $8 billion in short dollar positions were covered on the week ending May 17, so we could be getting closer to a significant bottom.
Gold
SPDR Gold Trust (GLD) easily overcame the swing high of $148.19 last week and, on a close above $150, should move to the prior highs at $153.61. The 127.2% retracement resistance target is at $156.90.
I was looking for some additional weakness last week as a buying opportunity, but GLD opened strong Friday. There is initial support for GLD at $147.60, and then stronger support in the $146.20 to $147 area. It's tough to trade, and I would not chase the long side.
Silver
The iShares Silver Trust (SLV) appears to have completed a short-term bottom in the $32 to $34 area, as the close above $34.80 was positive.
The stronger resistance at $37.90 could be tested, with the 50% retracement resistance to follow at $40.17.
Interest Rates
Mortgage rates hit a new low for the year this week, and the yield on the ten-year Treasury closed below its 200-day MA, which was surprising. A rally in stocks should cause yields to pick up a bit, but yields need to close above 3.25% to break the downtrend.
The Week Ahead
The market internals on Friday were stronger than the major averages, which is a positive sign. Still, a stronger rally was needed to confirm that the correction was over.
The major averages are likely to break their downtrends this week, and if so, this should start some serious short covering, along with buying from those on the sidelines. The rally could last a few weeks, as the short position is quite large.
Since late April, I have taken a more cautious stance, and I still think that a move back toward or above the May highs will be an opportunity to raise some cash.
Fewer sectors are moving the market higher, which is consistent with a market that is beginning to top out. Therefore, a deeper correction is more likely as we get into the summer months.


