Lingering fears about the markets will bring more choppy trading, but watch for buying opportunities in more defensive sectors, writes MoneyShow.com Senior Editor Tom Aspray.
Last week’s plunge in the stock market certainly shifted the focus back to not only the concerns over the US recovery, but also fears of a new recession.
The market resumed on a bullish note after the Memorial Day weekend, as the initial news about Greece’s debt problem was encouraging. That ended in a hurry on Wednesday, as a leading index of manufacturing activity fell to a 19-month low and the ADP Employment report painted a dismal picture for jobs.
The major decline in stock prices on Wednesday had some of the earmarks of a panic selloff, as the gains of the past five days were quickly erased. The “wall of worry” that I referred to last week got considerably higher once the dire headlines in the financial press had investors running for cover.
As stock prices plunged, there was a rush to safety as the yield on the ten-year Treasury dropped below 3% for the first time since last December. Even the 30-year US bonds got a momentary boost, and of course, the dollar came under further pressure.
The market was therefore expecting a very weak jobs report on Friday, and we got just that, as the number of new jobs was even lower than most downgraded estimates. Stocks plunged on the opening, with the cash S&P reaching a low of 1297.90 in early trading and the Dow was down almost 145 points. Both averages closed above the lows, but investors are now wondering whether there is any hope for stocks this summer.
As I discussed on Thursday in an in-depth technical review of the stock market, there are no signs yet that this anything more than a correction within the uptrend from the March 2009 lows. Since the major averages topped in early May, one can make a strong case for a good rebound in the next few weeks, especially if the bearish sentiment continues to build.
However, last week’s plunge has caused some damage to the confidence in the market, so choppy trading is likely before stocks can mount a decent rally.
See video: Watch Out for the Chop
The news late Friday of progress in the resolution of Greece’s debt problems took some pressure off the US markets, and most of the European markets were a bit higher, while the Greek stock market was up over 4%.
The euro bounced as well, but there are still worries about the contagion spreading to Spain, Italy, and/or Belgium. The auction of Spanish bonds went better than expected which was a slight positive.
Very little on the economic calendar this week, with Ben Bernanke speaking at the Atlanta IMF conference on Monday, then the report on jobless claims due Thursday.
Several other monetary officials will also be speaking this week, which may shed some light on the end of QE2. Clearly still overhanging the markets and the economy is the ongoing debate over the debt ceiling.
NEXT: WHAT TO WATCH
|pagebreak|WHAT TO WATCH
For most investors, the longer-term trend is what should be important, and for any position, it is critical that stops be used. The weekly and monthly analysis is the best way to get a clear picture of the dominant trend.
As I’ll discuss in more detail below, here are the key support levels to watch:
- Dow Industrials: 12,093 and 11,555; Diamonds Trust (DIA): $120.65 and $115.51
- S&P 500: 1294.70 and 1249.05; Spyder Trust (SPY): $129.51 and $125.28
- Nasdaq 100: 2298.72 and 2254.88; PowerShares QQQ (QQQ): $56.47 and $55.32
- Russell 2000: 807.93 and 775.90; iShares Russell 2000 Trust (IWM): $79.75 and $77.57
S&P 500
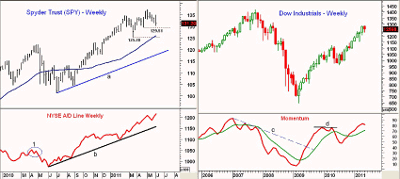
The Spyder Trust (SPY) violated the critical short-term support at $131.38 on Thursday while the daily uptrend at $130.50 was broken on Friday’s opening. SPY has closed back above that level and the April lows at $129.51 are still holding.
On a clear violation of this level, the next important support is at the March lows of $125.28.
The weekly NYSE Advance/Decline (A/D) line is a key measure of the market’s internal strength, and it will make a new high this week. Unlike the market high in April 2010, when the A/D line formed a negative divergence (see circle), no divergences are now evident.
Both the S&P 500 and the weekly A/D line are well above their major support, as indicated by the uptrends, lines a and b.
Resistance for SPY is now at $132.50 and $134.50.
Dow Industrials
The monthly chart of the Dow Industrials shows that momentum did turn down slightly in May, but no divergences have formed.
At the April 2010 highs, momentum did form a negative divergence, line d. Of course, at the 2007 bull market highs, a much stronger divergence was formed (line c).
The Diamonds Trust (DIA), like SPY, has violated the May lows at $122.80, but it is holding above the April low at $120.65. A break of this level would increase the odds of a decline to the March lows at $115.51.
Resistance for DIA is now at $124 with further resistance at $125.50.
Dow Transportations
The Dow Transportation Index is an important market average to watch since it has been a leader since the March 2009 lows. The key support levels to watch are at 5175 and then 4907.
Nasdaq 100
The PowerShares QQQ Trust (QQQ) has not yet violated the May lows at $56.47 and has further support at $55.32. First resistance is now at $57.45 and then in the $58.50 area.
Russell 2000
The iShares Russell 2000 Trust (IWM) topped out ahead of the major average in April and just barely violated the May lows at $80.76 on Friday. Once below $80.76, the next major support is at $79.75 and then $77.57.
Resistance for IWM is heavy in the $83.50-$85 area.
NEXT: Sector Focus
|pagebreak|Sector Focus
I released a detailed analysis of the second-quarter sector performance on Friday, concluding that the Select Sector SPDR - Consumer Staples (XLP) and the Select Sector SPDR - Health Care (XLV) have performed the best this quarter.
Both of these more defensive sectors look attractive on corrections to stronger support, and I also like the Select Sector SPDR - Utilities (XLU).
The Select Sector SPDR - Financial (XLF), Select Sector SPDR – Energy (XLE), Select Sector SPDR - Industrial (XLI), and Select Sector SPDR - Materials (XLB) all still look weak. XLF is reaching major support and is oversold, so a bounce is likely.
For more on the sectors, including recent performance, please read “The Best Sectors for Summer.”
Oil
The move out of high-risk assets clearly hit crude oil last week, as July crude dropped from its high at $103.39 last Tuesday to a low of $98.12 on Friday.
Crude is still above good support in the $95.54-$96.35 area, and it will take a break of these levels to signal a decline to the $92 area.
There is very strong resistance for July crude oil at $104-$105.50.
US Dollar
The negative sentiment on the US economy, along with the low US yields put further pressure on the PowerShares DB US Dollar Index Bullish Fund (UUP).
A test of the support at $21.10 and the recent lows at $20.84 is clearly possible, but don’t be too negative, as a bottom is possibly forming.
Gold
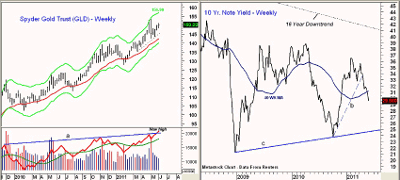
The SPDR Gold Trust (GLD) has benefited from the move out of risk assets, as it is seen as a safe haven like the Treasury market. The next resistance for GLD stands at $153.61 with the weekly starc+ band and the 127.2% retracement resistance target both at $156.90.
It is unusual for two different methods to come up with the same price target. The strong action of the weekly on-balance volume (OBV), which is already at new highs, is a very bullish sign.
Over the past few weeks, there has been little in the way of a pullback in GLD, with initial support now at $147.60-$148. Much stronger support stands at $143.42.
Silver
The iShares Silver Trust (SLV) has not rallied alongside gold, as it turned lower from the resistance at $37.90 and closed just above the support in the $34.80-$35 area.
There is next support for SLV at $33.38 and then at $31.97. A break of this level could trigger another wave of selling.
Interest Rates
The flight from risk pushed the yields on the ten-year Treasury notes below 3.0% to a low of 2.948%. The weekly uptrend, line b, was broken in late April, and the drop below the 40-week moving average (MA) at 3.11% suggests rates can still move lower.
There is additional support now in the 2.80% area with long-term support near 2.47%.
The Week Ahead
Even though stocks closed near the lows on Friday, more selling is possible early next week, but choppy action is most likely.
Many of the technical readings are getting oversold, and the closeness to next good support levels could bring in some buying. Clearly, the public, who has not been too excited about stocks in the past few months, is unlikely to jump back in given last week’s drop.
Still, the positive intermediate-term technical readings do not suggest a major top is complete, so the current decline should present a good opportunity in more defensive sectors that are showing the best relative performance.
From a technical perspective, a move back towards the May highs is expected and will be an opportunity to raise some cash.


