
The charts on some smaller oil-and-gas related stocks are showing technical potential. Here are some examples of companies with fundamentals that suggest more buying could be ahead, writes MoneyShow.com contributor Kate Stalter.
The energy sector is the second-best performer in the small-cap S&P 600 index so far this year, behind only consumer discretionary.
Of course, that means consumers have continued their shopping sprees at places other than the fuel pump. But I ran some screens to see which small energy names were leading the pack.
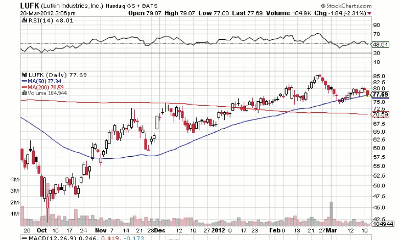
Among index components, one of the most heavily weighted from the energy sector is Lufkin Industries (LUFK), which makes pumps and electrical gear for the oil-and-gas industry.
Click to Enlarge
The stock has been attempting to rally out of a steep correction that began last April. The downside move undercut, by a long shot, a failed base that formed in April, May, and June of last year.
Though a steep price decline on a chart is discouraging at first glance, it can actually be an excellent mechanism for flushing out investors lacking in conviction. That happens time and time again—in a fundamentally strong company, anyway, or one with a bullish sales or earnings outlook.
In Lufkin’s case, the stock had a bullish moving-average cross in February, when the 50-day line moved above the 200-day. For more aggressive investors seeking an even earlier opportunity, the cross of the ten-day line above the 20-day in early January could have provided a buy point.
The stock has pulled back in recent weeks, but is continuing to get solid ten-week support. It’s currently forming a handle formation in the upper half of its consolidation—often a bullish precursor to further price gains.
A handle buy point may occur as the stock climbs above resistance at $85.68. Heavy volume on the uptick would signal institutional buying.
Wall Street has good estimates for the company’s earnings in the next two years, seeing income growth of 67% and 40%. Earnings have been powered by revenue increases—always a better indicator than cost cuts as the driver for profit gains.
Growing revenue and earnings tends to get the attention of institutional investors, so if the company continues performing well fundamentally, we may see more professional investors jumping onboard.
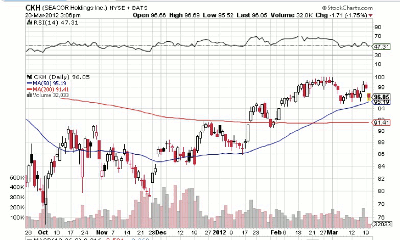
Another energy-sector name that’s heavily weighted within the small-cap index is Seacor Holdings (CKH), which provides equipment and services to offshore drillers.
Click to Enlarge
This stock is also getting support near its ten-week line, and may offer a handle buy point if it rebounds above the $100 level.
Earnings and revenue growth have been lackluster, but Wall Street expects that situation to turn around. Earnings are seen coming in at $5.99 a share this year, more than triple last year’s level of $1.91 per share.
However, last month, the company said it would sell its National Response oil-spill cleanup unit, so the growth may come partially from such moves, rather than organic revenue increases. Perhaps not coincidentally, the 50-day moving average crossover occurred on the day the National Response deal was announced.
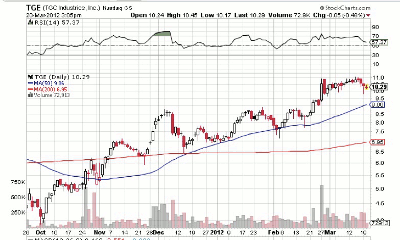
|pagebreak|A better fundamental and technical performer from the oil-and-gas-services business is TCG Industries (TGE). This is a very small stock, with a market cap of only $198 million. It trades 147,000 shares a day, on average.
Click to Enlarge
The company does seismic surveys for oil-and-gas explorers. This is a fairly low-priced name, with shares hovering below the $10 level on Tuesday.
Here, too, the fundamentals could be a driver for further buying. Analysts expect earnings of $1.14 a share this year, nearly double last year’s level. In 2013, Wall Street has pegged profit at $1.45 a share, a gain of 27%.
The stock is up nearly 44% this quarter. The earnings picture has improved in recent quarters, as the company recovers from some losses in 2010. Quarterly revenue has grown at double- or triple-digit rates recently.
At the moment, the stock is extended from a buy point above $8.76, which it cleared in January. It’s currently pulling back from last week’s high of $11.06, its best level since 2006. As always, a consolidation, while signaling that earlier investors are taking profits, could offer new buyers a chance to get in.
Watch for continued support at or near the ten-week average. The stock is now trading about 12% above that key price line, which is at $9.22. A slice below that line, particularly in heavy volume, would be a sign that traders and investors are bailing out of the stock.
At the time of publication, Kate Stalter did not own positions in any of the stocks mentioned in this column.
Related Reading:


