
Don't take the unemployment numbers at face value; scratching the surface reveals the real meaning behind the numbers and can help you in your investment strategy, writes the staff of Briefing.com.
The unemployment rate has improved over the past few years. But a deeper analysis of the numbers shows that the issue is more complex than just the single unemployment rate number. Some categories within the “not in the labor force” metric have not shown the same type of improvements, such as the number of discouraged workers.
The Employment Data
The BLS begins their calculation of employment data with an estimated number for the entire population of the US. This number is then reduced by a calculation for the total number of people who are under the age of 16, those people in institutions (primarily prisons and retirement homes), and those persons in the armed forces.
This resulting segment of the population is called the “civilian non-institutional labor force.” There are three segments of the civilian non-institutional labor force:
- Employed
- Unemployed
- Not in the Labor Force
The measurement of the three elements of the civilian non-institutional labor force is done by a weekly survey of a set of citizens. This survey data is then extrapolated to represent the entire employment situation.
Employed persons are those actively working in the current week. Unemployed persons are those who had no employment in the week of the survey, but were available and willing to work, and had made specific efforts to find a job in the past four weeks.
The “labor force” is defined as the combination of the employed and the unemployed. The unemployment “rate” is calculated as the percentage obtained by dividing the unemployed data into the labor rate data.
The “not in the labor force” category primarily includes persons who might otherwise be eligible for employment, but neither hold a job, nor are actively seeking a job. This category includes all stay-at-home parents and retired persons not in a retirement home, for example.
However, also included in the “not in the labor force” category are any potential workers who have not actively sought a job in the past four weeks, but both want a job and are available for a job. It is the subcategories of the “not in the labor force” category that show a different story than that told by the unemployment rate metric.
The Unemployment Rate
There is no question that the unemployment rate has been declining in recent years.
The following graph summarizes the unemployment rate over the past five years. As the graph shows, unemployment spiked up sharply in 2009, after the financial collapse in the fall of 2008.
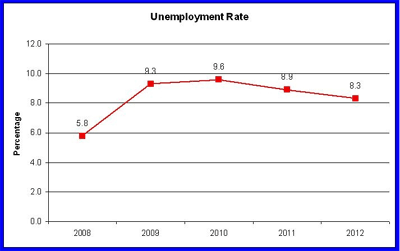
Click to Enlarge
This chart clearly tells a story of an improving unemployment rate in the past two years. This is the story that is most usually told when the employment situation is discussed, particularly when talked about by the mass media.
|pagebreak|The Labor Force
The unemployment rate number, however, is a percentage calculation of the number of unemployed persons as a percentage of the labor force, which is defined as the total of the employed and the unemployed.
The civilian non-institutional population, however, includes persons defined as "not in the labor force." This category includes some people who are actually unemployed, but would prefer to be employed, if possible.
The following graph shows the changes in the labor force, its two categories—employed and unemployed—and the category of "not in the labor force," which includes some unemployed persons.
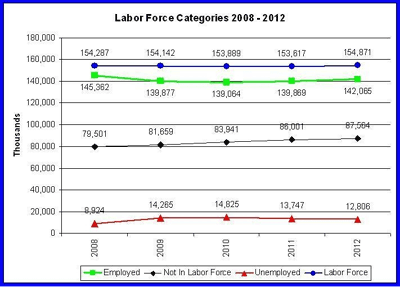
Click to Enlarge
As the chart shows, total labor force is roughly the same as it was in 2008, having only increased by 584,000 people.
The number of employed workers, however, has decreased by 3.3 million workers since 2008, while the number of unemployed workers has increased by 3.9 million workers. Despite the story of an improving employment situation, this means that the number of unemployed people has increased more than the number of new jobs created since 2008.
Nevertheless, in recent months, the number of unemployed has been declining, leading to the story of an “improving employment environment.”
An analysis of the changes since 2010, when the change from 2008 was more than 6 million jobs lost, also tells a less than positive story. Since 2010, the number of jobs has increased by 3 million workers, yet the unemployed workers only decreased by 2 million persons.
Clearly, not everyone who was out of work in 2010 was able to get one of those newly created 3 million jobs, or the unemployed metric would have decreased by 3 million. This aspect of the “unemployment situation is rarely highlighted by the mass media.
The category of "not in the labor force," however, has shown a steadily increasing trend since 2008, which is where the most dire aspect of the unemployment situation gets buried.
The “Not in the Labor Force” Category
As shown in the graph above, the “not in the labor force” category shows the trend of all persons not in the labor force, which has steadily risen since 2008. This category includes stay-at-home parents, retired persons, and students, who combined make up the bulk of the category.
It is in the subcategories of the “not in the labor force” where the more intriguing story of employment unfolds, however.
The first subcategory is “persons who currently want a job.” This category includes any worker who wants employment, but has not searched for work in the past four weeks, and may or may not have been available for work in the week of the survey.
Within this subcategory is another, called “marginally attached to the labor force.” These are defined as “persons who want a job, have searched for work during the prior 12 months, and were available to take a job during the reference week, but had not looked for work in the past four weeks.”
|pagebreak|An additional subcategory is called “discouraged workers.” This category is defined as “those who did not actively look for work in the prior four weeks for reasons such as thinks no work available, could not find work, lacks schooling or training, employer thinks too young or old, and other types of discrimination.”
Note that the primary characteristic of all three of these categories is that the person has not searched for work within the past four weeks. To be classified as “unemployed,” the person must have searched for work actively during the prior four weeks.
The following chart illustrates the trends in all three of these categories:
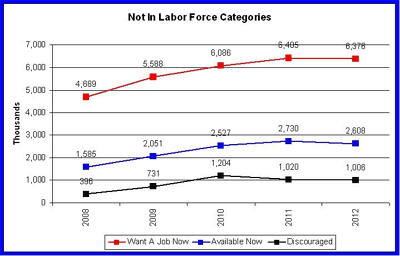
Click to Enlarge
In this chart, while there has been some improvement in the categories in recent months, the overall trend is generally upward. All of the categories shown above represent unemployed persons who want a job, but none of these persons are included in the unemployment rate.
The most striking trend here is the number of “discouraged workers.” This type of worker has completely given up on the possibility of obtaining a job.
The 2010 metric of 1.2 million discouraged workers is the highest level reported in the past ten years. The 2008 level of 396,000 discouraged workers is approximately the same as the level of 2002, which showed 375,000 discouraged workers. It is only in the past few years that the level of discouraged workers has increased to more than one million.
The trend for workers who want a job and are available, but haven’t searched for a job in the past four weeks, shows a continually increasing trend since 2008. The data for 2012 shows a modest decline, but this data point is non-seasonally adjusted monthly data (for February 2012), while the others are annual data points. The data for 2012 may eventually show a continuation of the upward trend since 2008.
Conclusions
The unemployment rate, when examined in isolation, shows an improving employment picture for the US. However, a closer examination of the metrics tells a more detailed, and slightly more complex, story.
Since 2008, the data shows the following negative aspects of the employment picture:
- More jobs have been lost than have been created (nearly 600,000).
- The number of workers who both want a job and are available, but are not counted as unemployed, has increased by more than 1 million.
- The number of discouraged workers remains at over 1 million, 2.5 times higher than the levels of 2008 and earlier.
The only key difference between the unemployed and those classified as “not in the labor force” is whether the person has actively sought a new job in the past four weeks.
When those persons in the "not in the labor force" category are taken into consideration, along with those classified as “unemployed,” the employment situation takes on a much less positive tone than that portrayed by the unemployment rate alone.
Read more from Briefing.com here...
Related Reading:


