Clothing makers are showing signs of potential strength, but fresh uptrends in these charts could depend on action in the major indices in the coming weeks.
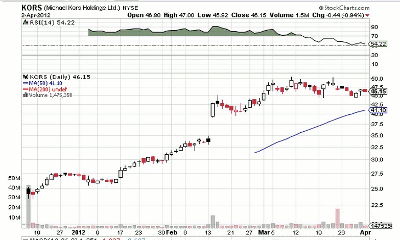
I’ve written several times about one of the leading stocks that I’ve been tracking, Michael Kors (KORS), which has been consolidating price gains below its March 9 price high of $50.69.
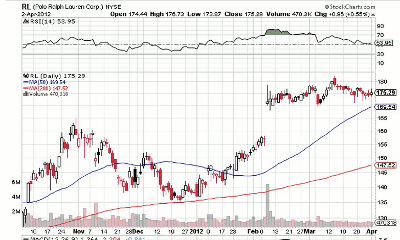
However, Kors is not the only high-end clothing maker showing bullish chart action. Another company named after its designer founder, Ralph Lauren (RL), has been trading in a sideways pattern, and could be setting up for further gains.
In recent months, the stock has sported the kind of chart action that often leads to new price highs. In early August, as the major indices were falling hard, Ralph Lauren fell to an intraday low of $105.11 on August 9. That undercut the trough of the prior consolidation, a cup-shaped base, and set the stage for value buyers to grab shares at a bargain.
With the broader market showing volatility, individual stocks like Ralph Lauren also traded in a choppier fashion than normal. It rallied to a new high on October 31 of last year, then retreated into correction as the major indices suffered another bout of selling.
However, by that time, the trading character of Ralph Lauren had settled down, and the stock formed an orderly three-month consolidation that found support near its 40-week moving average.
It cleared that consolidation in monster volume on February 8, after a better-than-expected sales outlook. It’s meandered in a fairly tight range since then, a trading pattern that can often serve as a springboard to further price gains.
Another bullish aspect of the current price consolidation is low volume. When a stock goes into a holding pattern, trading sideways, it’s best if turnover is below average. That means there is not a lot of churn—in other words, heavy buying and selling without appreciable effect on the price.
Low volume means professional investors are holding shares at a given price level, a good signal of their confidence in the stock.
However, keep in mind: When compared to a current market leader like Kors, this stock is clearly lagging. At the moment, Kors is the apparel maker that growth investors should be eyeing. However, Ralph Lauren could be showing some potential over the medium term.
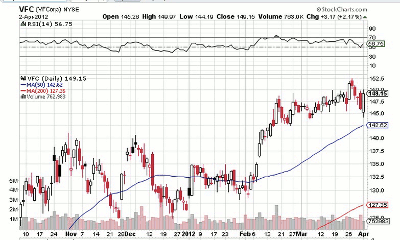
One of Ralph Lauren’s apparel-industry peers, VF Corp. (VFC), is showing very similar chart action currently. Like Ralph Lauren, VF is also touching its ten-week line after several weeks of sideways trade.
It, too, fell beneath the low of its previous consolidation last summer, clearing the way for bargain shoppers to grab reduced-priced shares.
These are two similar stocks of companies in similar lines of business. Both have market caps north of $16 billion, although VF is more widely traded, with about 1 million shares changing hands each day on average.
Though Ralph Lauren is slightly less liquid, I prefer the current trend of lower trading volume. If I had a choice between the two stocks, that below-average turnover would likely push me toward the iconic polo pony.
At the moment, a buy point for Ralph Lauren could occur as the stock clears its March 14 high of $182.48, ideally in heavy volume. For VF, the current buy point is above $152.50.
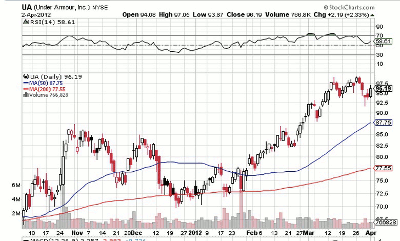
Recent IPOs—meaning stocks that have gone public in the past few years—are among the names I scan for on a regular basis. Under Armour (UA), which went public in November 2005, may also be in the early stages of a flat or sideways price consolidation.
Here, too, last summer’s pullback undercut the earlier base’s low, and Under Armour went on to reach a new high in November. It formed another base, an orderly cup-shaped pattern, which eventually led to last month’s high of $99.10. It’s currently pulling back from that high, holding above its ten-week moving average.
The Baltimore-based athletic clothing maker reports its first quarter later this month, so that could be a catalyst for a price move in either direction.
With lower volume price gains in the general indices, along with recent selling pressures—despite the S&P 500’s move to a multiyear high—the markets are showing they could be ready for a breather.
In that case, watch for these stocks to continue showing price performance that outpaces the indices. In other words, continued trade near key moving averages, or sideways action, would indicate ongoing strength, even in a possible market downturn.
At the time of publication, Kate Stalter did not own positions in any of the stocks mentioned in this column.
Related Reading:


