The markets are not out of the woods, but a number of potential plays have nearly reached attractive levels, including two well-supported ETFs, writes MoneyShow senior editor Tom Aspray. Keep your powder dry and look for a recommendation soon, he advises.
Stocks tried to stabilize last week while the Euro crisis simmered on the back burner. Even though more seem ready to accept the possibility that Greece will leave the euro, concerns over the health of the global economy continues to grow.
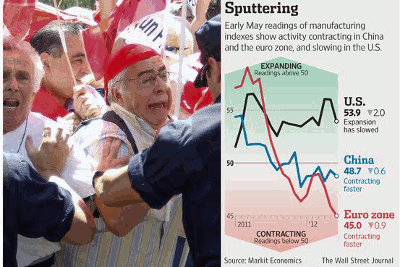
The decline in US durable-goods orders last week added to this concern, as did the manufacturing data from Europe and China, which indicated their economies were contracting. The chart below shows that the manufacturing indexes for the Eurozone and China have been below 50 since late in 2011:
It is still my view that despite the signs of a weakening economy, Chinese leaders will do whatever it takes to avoid a so-called “hard landing.” So far, they are proposing a wide range of steps to spur economic growth. But if that does not work, I would expect them to take more aggressive action as we head into the summer months.
I do not have as much faith in the collective power of the Eurozone countries to do what they have to in order to bring stability, but I am not convinced they will let things deteriorate to the stage where the global economy collapses.
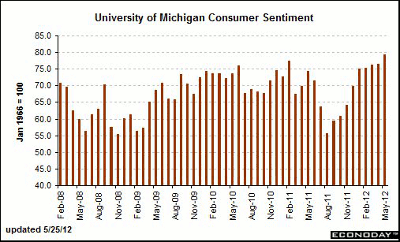
Investor sentiment is still not bearish enough to suggest a major low is in place, but the 15% decline in crude oil prices is likely to help consumer sentiment improve even further. Last Friday, the University of Michigan survey surprised many by jumping to 79.3, the best reading since February 2008.
The data on the housing market was also more positive, as both existing- and new-home sales were better than expected.
A ton of economic data is coming out this holiday-shortened week, with the S&P Case-Shiller Housing Price Index, consumer confidence numbers, and the Dallas Fed Manufacturing Survey all out on Tuesday. On Wednesday, we get more news on housing, with pending home sales data for April.
The data at the end of the week is likely to fuel either a sharp short-covering rally or more selling. On Thursday, we will see the ADP Employment report, GDP, jobless claims, and the Chicago Purchasing Managers Index.
These are followed on Friday by the monthly jobs report, personal income, and the ISM Manufacturing Index. If the stock market is weak heading into the jobs report, stocks could form a panic low, as many high-yielding stocks are now reaching attractive levels.
The sharp swing in sentiment from the financial media is tough for most investors to take. Less than two months ago, Jeremy Siegel was forecasting that the Dow could hit 17,000 by the end of next year. But now, gloom and doom seems to be prevailing, and some are already talking of the next recession as if it was a foregone conclusion.
Technically, there are still no signs of a major top in the US stock market. Therefore, I expect this correction to set up a good buying opportunity.
I continue to favor US equities for the bulk of investors’ portfolios, though I have recently added positions in an inverse ETF, as well as a long bond and short euro ETF. These positions are being watched closely for signs of a turn, and part of the short Euro position has already been covered.
|pagebreak|WHAT TO WATCH
The failure of the stock market to rally sharply last week, despite the extreme oversold readings, does raise the possibility that we will have another move to new lows over the next week. This was discussed in more detail on Friday, as was my outlook for Apple (AAPL) and the tech-heavy PowerShares QQQ Trust (QQQ).
The JPMorgan Chase (JPM) trading fiasco and Facebook’s (FB) IPO made the stock market’s decline look worse than it has been. But it is important to note that so far, the Spyder Trust (SPY) has held above its 38.2% support.
It is also important to differentiate between the minor and major trend for stock prices. While the minor trend has been clearly negative since early May, when the Advance/Decline lines broke support, the major trend is still positive.
Over the next few weeks, I expect to see a fairly decent stock-market rally. It will be the strength or weakness of this rally that will help clarify the outlook for the summer months.
S&P 500
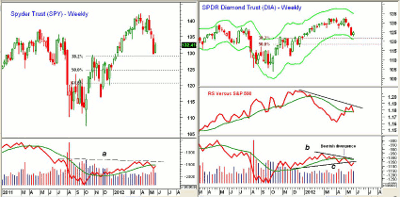
The weekly chart of the Spyder Trust (SPY) reflects last week’s slightly higher close, yet SPY is still down close to 6% for May.
The major 38.2% Fibonacci retracement support from the October 2011 lows is at $128.90. If we test or break this level before we move back above the short-term resistance at $134, then it is more likely to complete a short-term bottom. There is additional support in the $127.50 to $128 area.
The weekly on-balance volume (OBV) did turn up this week, but is still below its declining WMA. A weekly close back above its WMA would be a positive sign. A move above the resistance (line a) would be much more positive.
The A/D line (not shown) has risen from its lows, which has relieved some of its oversold status, but it is still well below its declining WMA. If the SPY makes new correction lows early this week, short-term A/D indicators like the McClellan oscillator could form positive divergences.
Dow Industrials
The SPDR Diamonds Trust (DIA) was barely higher than the SPY last week, but not far above the major 38.2% Fibonacci retracement support at $122. The more important 50% support stands at $118.56.
The relative performance, or RS analysis turned down last week and is now testing its WMA. The DIA had been acting stronger than the S&P 500 since early April.
The weekly OBV looks weaker on the DIA than it does on the SPY, as it has broken its uptrend from the November lows (line c). The OBV did form a negative divergence at the early May highs (line b).
The Dow Industrials A/D line (not shown) is still holding above the uptrend from the 2010 lows. However, the Dow A/D line is still well below its WMA, and did not rebound much last week.
The DIA has initial resistance now in the $126.25 area, and a close above this level should signal a rally to the $128 area. More formidable resistance follows at $130.
Nasdaq-100
The PowerShares QQQ Trust (QQQ) was hit the hardest in May, down over 7%. It is now getting closer to its major support.
The 38.2% support was violated on May 17, which from basic Fibonacci analysis forecasts a drop to the 50% support level at $59.22. (For more on Fibonacci, read “Fibonacci Analysis: Master the Basics.”)
The Nasdaq-100 Advance/Decline (A/D) line is trying to turn higher, but still is well below its WMA and then its downtrend. For more details on the QQQ and where I would be looking to buy it, see Friday’s column. There is initial resistance near $63, and then at the declining 20-day EMA at $63.51.
Russell 2000
The iShares Russell 2000 Index Fund (IWM) is down just over 6% for the month, but was a bit higher last week. A daily close above $77 would be a short-term positive, but IWM has much stronger resistance in the $78.50 area.
The Russell 2000 A/D line (not shown) is still acting weak, having continued to make new lows. It was not impressive last week.
There is near-term support now around $74. The downside target from the H&S top is in the $71.40 to $72 area.
NEXT: Sector Focus, Commodities, and Tom’s Outlook
|pagebreak|Sector Focus
If the stock market is going to end its correction in the next month or so, now is the time to examine the technical action of the individual sectors to see which ones might have the best potential once stocks turn higher.
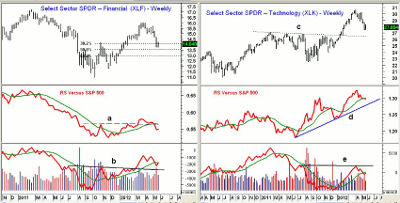
As I mentioned at the end of the first quarter, the high-flying Select Sector SPDR Financial (XLF) was the most vulnerable, and that was before anyone new about JPMorgan’s troubles. Since April, it is down over 11%, and has come very close to the 50% retracement support at $13.50. The 61.8% support is at $12.90.
XLF’s relative performance staged a weak breakout in March, but has now dropped below the breakout level (line a). The weekly OBV did turn up last week, and while it is below its WMA, it has good support (line b).
The long-term chart of the Select Sector SPDR Technology (XLK) does look more attractive, as it staged a major breakout above resistance (line c) in early 2012. From a technical standpoint, a retest of the breakout level in the $26.80 to $27.20 area would be quite normal.
The relative performance still looks quite strong (compare it to XLF), as it shows a clear pattern of higher highs and higher lows. It is now slightly below its WMA, but is well above its uptrend (line d). The weekly OBV is slightly below its WMA, and a move above the resistance (line e) would be a very positive sign.
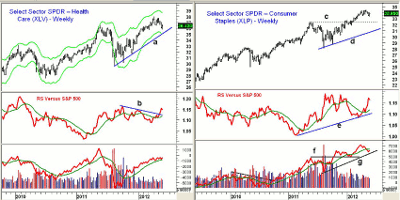
The Select Sector SPDR Health Care (XLV) is down just over 3% for the month of May, and closed firm on Friday. The weekly chart still looks clearly positive, as it has held well above the March lows at $35.68, as well as the uptrend (line a). A close back above $37.80 would reassert the uptrend.
The RS line moved through its resistance (line b) two weeks ago, signaling that it was acting better than the S&P 500. The OBV is still holding above its WMA.
The Select Sector SPDR Consumer Discretionary (XLY) has been hit hard lately. It’s not surprising, as the death of the consumer is once again a popular theme.
The Select Sector SPDR Consumer Staples (XLP) has done much better—down just over 1% in May, versus the 5.6% drop in XLY. The weekly chart shows good support at the 2011 highs (line c) in the $32.50 area. The uptrend (line d) is just below $31.
The RS line is testing its previous highs, and is well above its rising WMA. The weekly OBV shows a very positive pattern, as it pulled back to support (line f) early in the year before surging to new highs. It is now holding above the late 2011 highs, with further support at line g.
NEXT: Oil, Metals, and Tom’s Outlook
|pagebreak|Crude Oil
The July crude oil contract was up slightly last week, but after the decline from the early highs at $106.77, this is not surprising.
July crude is down 14.9% in May. Though it had a low of $89.28 last Thursday, it has still not closed below 61.8% Fibonacci support at $90.41.
Precious Metals
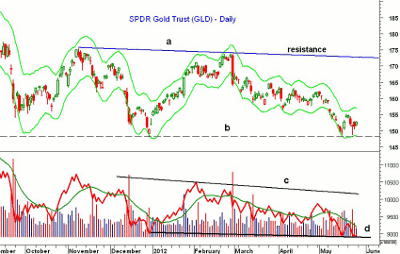
The SPDR Gold Trust (GLD) dropped down to $148.84 last Thursday, which was just above the prior low at $148.60. The December 2011 lows were at $148.27 (line b). Though the chart shows a potential short-term bottom, the OBV has made lower lows (line d).
It will be important to watch the volume on any rally, as the weak volume on the last bounce indicated that a bottom was not in place. The OBV needs to overcome the major resistance (line c) to confirm that an important low is in place.
The Week Ahead
The lackluster action of the stock market last week—especially the weak close on Friday—does not set a good tone for this week. Nevertheless, the action suggests that another new low in the major averages may be well supported.
The initial downside targets mentioned in early May are close to being met. More importantly, some of the stocks that are showing the best relative performance are now reaching good support.
The markets are going to be bombarded by economic news this week, and though it may provide the catalyst for another wave of selling, it is also possible that one of the reports will help turn the stock market around.
Patience is still the key, but be ready to buy some of the favored stocks if panic selling takes them to major support. Also look for some new buy recommendations in Select Sector SPDR Consumer Staples (XLP) and the Select Sector SPDR Health Care (XLV) this week.
- To view the current Charts in Play portfolio, click here
- Also, don’t forget to read this week’s Trading Lesson, 4 Industry Groups Beating the S&P 500

