
Those seeking the safety of Treasuries in the event of a financial collapse are fearing the highly unlikely and leaving more favorable profit opportunities on the table, writes Tom Aspray.
Any investor who enjoyed the Memorial Day weekend is likely glad they did, as the holiday-shortened week that followed in the markets was painful. Though stocks managed very nice gains last Tuesday and ignored weaker-than-expected manufacturing data from the Dallas Fed, the worrisome economic data hit the market like a tsunami by the end of the week.
The inability of the stock market to continue higher last Wednesday completed the oversold rebound from a technical standpoint and set the stage for plunging stock prices at the end of the week. The weaker-than-expected numbers on pending home sales Wednesday did not help.
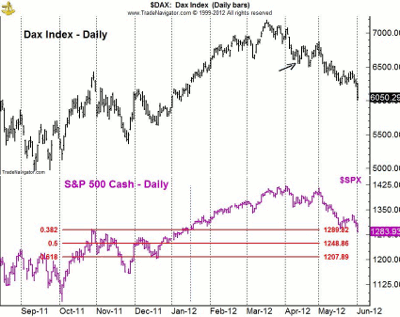
Though the S&P 500 was able to surpass the May 22 highs last Tuesday, the German Dax Index was not. The Dax has been leading world stock markets lower since April 13 when it broke below the March lows (see arrow).
Click to Enlarge
The S&P 500 did not break below the March lows until May 14. The Dax closed the week below its 50% Fibonacci retracement support, making the next key target at 5819, which is 3.8% below current levels.
The S&P 500 has now broken its 38.2% Fibonacci retracement support from last October’s lows with the 50% support now at 1248. The S&P is now entering a zone of chart support from late last year in the 1267-1280 area
For more on Fibonacci, read “Fibonacci Analysis: Master the Basics.”
NEXT: Dramatic Action in US Treasury Bond Market
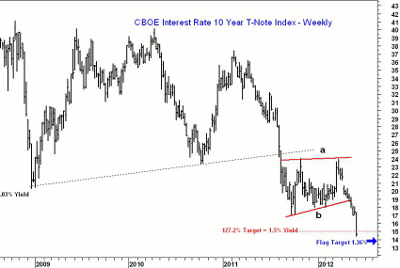
|pagebreak|Though the plunge in world stock prices was quite dramatic, the action in the US Treasury market was more historic. For the past two months, I have been discussing the flag, or continuation pattern (lines a and b), on the chart of the ten-year Treasury note yield.
In an early-May article “Bond Indicator Identifies Market Top,” I pointed out that bond traders were buying bonds and selling notes as stocks peaked in early April. Bond traders were anticipating sharply lower rates.
Click to Enlarge
The flag formation was completed soon after the column was released and the 127.2% Fibonacci target from the flag formation at 1.5% was exceeded this week. Yields have dropped 24% since the end of April, and the next yield target is at 1.36%.
T-notes and T-bonds are pricing in a financial collapse, and given the rate of inflation, buying either at current levels will mean a negative rate of return. My analysis and experience in the markets makes this type of economic Armageddon extremely unlikely at this time.
The stampede into US Treasuries was matched by a move to record levels in German bunds, which have become the other safe haven. Last week, the potential for Greece to leave the Eurozone was simmering on the back burner while the euro debt crisis focused on Spain’s problems instead.
Spain is the Eurozone’s fourth-largest economy, and with the nation’s bonds yielding close to the dangerous 7% level, it raised concerns about the need for a bailout. This also increased speculation that Spain would not be able to come up with the necessary funds for a EUR19 billion bailout of a Spanish bank.
If the clouds were not dark enough heading into Friday’s monthly jobs report, more dismal news about the manufacturing sector in China and the Eurozone pushed S&P futures down 12 points before the horrible job numbers were released. The losses were quickly doubled after the report was released.
The economic calendar is a bit less full this week with factory orders due out on Monday and the ISM non-manufacturing index on Tuesday. Wednesday’s Federal Reserve Beige Book release will likely receive more attention than the productivity and cost data that comes out earlier in the day.
Weekly jobless claims come out on Thursday with the latest numbers on international trade scheduled for Friday.
NEXT: What to Watch in the Week Ahead
|pagebreak|What to Watch
The failure of the stock market to rally had me concerned in last week’s column, and we certainly have gotten the new lows it was suggesting. All of the major averages and the ETFs that track them have now broken their 38.2% Fibonacci support levels as calculated from the October 2011 lows.
This makes the 50% retracement support levels the next key areas to watch. There is also some support from the highs last fall, which are 1%-2% below Friday’s close. Unfortunately, while the financial media has become very negative on the stock market, the financial newsletter writers as of last Wednesday were still too bullish at 38.4%.
The numbers from the American Association of Individual Investors (AAII) look a bit more encouraging, as only 28% are bullish, but I would typically expect this number to get down in the 20%-23% level before a bottom is in place.
Not all of the Advance/Decline (A/D) lines have made new lows with prices and the McClellan Oscillator is still well above its recent lows. Of course, before a tradable low can be formed, we need to see the formation of positive divergence followed by an impressive rally.
Nevertheless, the extent of the decline does suggest prices are likely to see a good oversold bounce in the next week or so. Many of the strong stocks in the strong sectors are still maintaining their long-term uptrends.
S&P 500
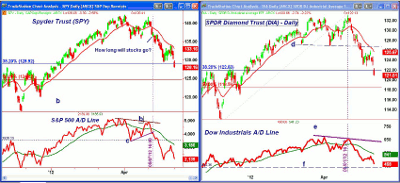
The rebound in the Spyder Trust (SPY) failed just below the short-term 38.2% retracement resistance at $134.20, which was calculated from the May high. The declining 20-day exponential moving average (EMA) was just “kissed” on the rally.
Click to Enlarge
SPY gapped lower last Friday and closed well below the 38.2% support at $128.92. The still-rising 200-day moving average (MA) was violated Friday, but SPY closed above it.
There is next support from last fall in the $127.20-$128 area and then at $125.50-$126. The 50% Fibonacci retracement support at $124.82.
The S&P 500 A/D line was able to rally back towards its declining weighted moving average (WMA), which relieved the oversold status I pointed out a few weeks ago. It is now very close to its recent lows, which are likely to be broken with further weakness on Monday.
The break of support in the A/D line, line c, completed the top formation on May 7. SPY has declined 6.4% since the break. The A/D line would need to move above the downtrend at line b to confirm a new uptrend, which, as the chart reveals, would take some time.
There is initial resistance for SPY at $129.60 and then at $130.50-$131.
Dow Industrials
The rebound in the SPDR Diamonds Trust (DIA) was weaker than that of SPY. DIA crashed through the major 38.2% Fibonacci retracement support at $122 and its 200-day MA on Friday.
The more important 50% support stands at $118.56. As I noted in Thursday’s Trading Lesson, the Dow Industrials started a new downtrend two weeks ago.
The Dow Industrials’ A/D line formed a negative divergence at the May 1 highs, line e, and did make new lows last week. It is still above the support from last fall, line f.
There is a band of resistance for DIA now in the $122.80-$125.80 area.
NEXT: Latest Chart Patterns for Nasdaq 100, Russell 2000
|pagebreak|Nasdaq 100
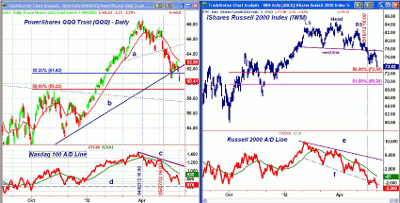
The PowerShares QQQ Trust (QQQ) also gapped lower last Friday but is still above the 200-day MA at $59.78. The 38.2% support was violated on May 17, which from basic Fibonacci analysis, forecasts a drop to the 50% support level at $59.22.
The Nasdaq 100 Advance/Decline (A/D) line came close to its declining weighted moving average on the recent rebound but has now dropped below the recent lows. It is now not far above the support from last fall, line d.
Click to Enlarge
The break in the A/D line below support on May 7 was a good sell signal. There is initial resistance now at $61.40 and then the declining 20-day EMA at $62.98.
Russell 2000
The iShares Russell 2000 Index Fund (IWM) completed its head-and-shoulders (H&S) top in the middle of May, which was consistent with the deterioration in its A/D line since early February.
The 50 % retracement support is not too far below Friday’s close at $72.30 with the target from the H&S top in the $71.40-$72 area. The key 61.8% support is at $69.38.
The Russell 2000 A/D line made lower highs as IWM was forming the head of its top formation, line e, and has been forming lower highs and lower lows since March, line f. It dropped to further new lows on Friday and continues to look very weak.
First resistance for IWM is at $75.55 and its 200-day MA with further resistance in the $77 area.
NEXT: Outlook for Key Sectors and Commodities
|pagebreak|Sector Focus
Though it was also down sharply on Friday, the iShares Dow Jones Transportation Average Index Fund (IYT) is still trading above its recent lows, which is one of the few positives we can find from Friday’s action. Of course, the sharply lower crude oil prices are definitely helping.
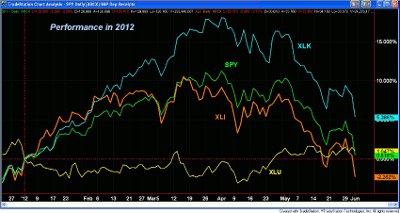
The 2012 performance chart shows that all of the key sectors have taken a beating over the past two months, with only the Select Sector SPDR - Utilities (XLU) improving since late April when its performance turned positive.
Click to Enlarge
The Select Sector SPDR - Technology (XLK) is still showing a 5.6% gain for the year, and as I noted last time, it is technically one of my favorite sector ETFs.
The Select Sector SPDR - Industrials (XLI) has turned negative for the year and the Spyder Trust (SPY) is not far behind.
While these three sector ETFs were down over 8% in May, the Select Sector SPDR - Consumer Staples (XLP) was only down 3.3%. I discussed XLP in more detail here last Wednesday and my initial buying level has been hit.
I also recommended the Select Sector SPDR - Health Care (XLV) and a couple of drug stocks that look very attractive for the longer term.
Click to Enlarge
Crude Oil
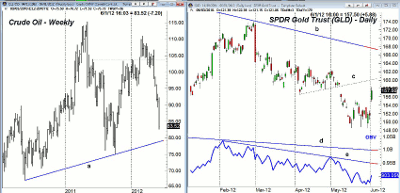
Crude oil continued to collapse last week, declining by more than $7 for the week and losing almost $3 on Friday alone. It has dropped 24.7% since the high in early March. Given the conventional stupidity of all politicians, I guess we have President Obama to thank for this, since it was his fault crude oil prices rose so high initially.
Crude oil is now getting closer to the weekly uptrend from the 2010 and 2011 lows in the $79 area. A drop below $80 will certainly get the market’s attention and should be an opportunity to buy some of the cash-rich, high-dividend-paying oil companies.
Precious Metals
The SPDR Gold Trust (GLD) was up $6 on Friday, or 4%. Volume was good on Friday at twice the daily average. There is next strong resistance in the $158-$160 area, line c, with the long-term downtrend in the $167 area.
The on-balance volume (OBV) has turned up nicely but is still well below its short- and longer-term downtrends, lines d and e.
It may turn out that Friday will mark an important low for GLD, but I will wait for more confirmation. Our long positions in Newmont Mining (NEM) are acting well.
The Week Ahead
Despite the Street’s conviction that the Eurozone is going to blow up and that the US is headed for a recession worse than the last one, I am starting to do some light buying in selected issues.
Though I understand that many are only going to be able to sleep at night in riskless assets like Treasuries, I think proper application of technical analysis can easily help investors beat Treasuries’ negative rate of return.
In March, the “Charts in Play” Portfolio only had about 16% in cash, but now has almost 60%, as I continued to raise stops and take partial profits. Clearly, over the past six weeks, many of my positions were stopped out.
I do not plan on getting more than 45%-50% invested until there are clear signs that the market’s decline is over. For those with cash on the sidelines, it is still a market for the patient investor, but I think you will want to start nibbling on the long side in the next few weeks.
To view the current Charts in Play portfolio, click here.
And, don’t forget to read this week’s Trading Lesson, “80-Year-Old Wisdom That Still Works.”


