Watch the VIX for signals that the market may be getting ahead of itself, says John Bougearel of Structural Logic CTA.
The S&P 500 Volatility ETF (VIX) is intended to measure investor complacency. Insofar as that may be an accurate description, complacency peaked during the March 15 Cyprus crisis.
Though the stock market is hitting record highs this week, investors are not nearly as complacent as they were a month ago, in March. But the additional policy stimulus from Japan is keeping the stock market sails full.
Nevertheless, the negative divergence of the VIX over the past few weeks is important to keep in mind, and reaffirms that defensive posture would be prudent.
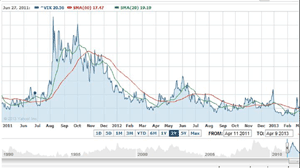
Not only is the VIX negatively diverging with stock prices, but it is also forming a bullish inverted head and shoulder pattern that began when the left shoulder was carved out on January 23. The right shoulder is being carved out now.
A year ago, we saw a similar phenomena in the VIX. From February 3 to April 26, 2012, the VIX carved out a bullish inverted head and shoulder pattern (an 11-week pattern). Three days after April 26, the S&P 500 set a secondary high on May 2 and began a 150-point decline (almost -11%) over the next 5 wks, ending June 4.
So, with the S&P 500 for all intents and purposes having reached its next significant target zone at 1,578 to 1,583, do we count to three or four, and anticipate a significant intermediate term high?
The VIX below shows 20- and 60-day (one- to three-month) moving averages. The 20-day average is converging with the 60-day from underneath. Less investor complacency and a bullish crossover would not surprise in May. If investors wait until May to walk away to rebalance, it may be a half-month too late.
Subscribe to Structural Logic CTA here...
Related Articles:


