
From a historical standpoint, the iShares Transportation Average ETF (IYT) has been the ETF to own in the month of November, looking back 10 years, notes Bernie Schaeffer, technical expert and senior editor of Schaeffer's Investment Research.
Specifically, the fund has averaged a healthy monthly gain of 4.72% — topping all but one ETF return on our list — and is one of just four ETFs to have settled November higher 90% of the time, per data from our Senior Quantitative Analyst Rocky White.
However, while the transports fund has history on its side, a meaningful bounce would require IYT rallying through a familiar area of “congestion.”
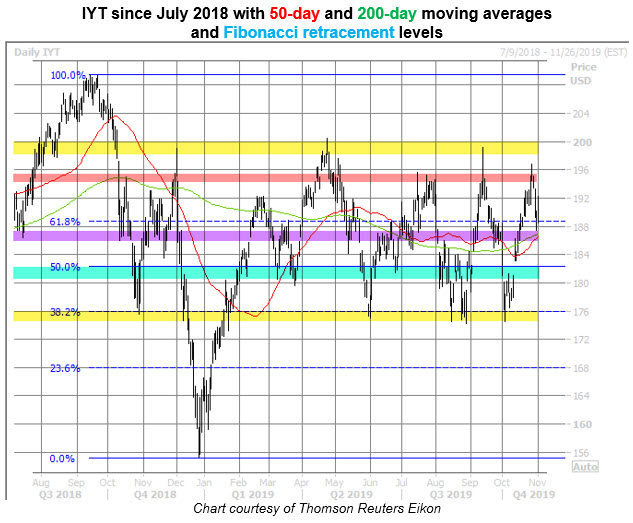
The ETF could once again stall in the $200 area. Not only does this region represent “round-number resistance,” but it’s also home to IYT’s annual high, touched April 24. In addition, the $198 area represents a 20% year-to-date gain for the shares.
And while absolute open interest is light compared to some other funds, it’s worth mentioning that the 190 strike is one options traders are watching. The November 190 put, in fact, is home to peak open interest across all series, with more than 3,300 contracts outstanding.
We are also keeping close tabs on the $189 level, which represents a 61.8% Fibonacci retracement of IYT’s September 2018 record high of $209.43 and its December 2018 two-year low of $155.24.
As for potential support in the short term, the $186 neighborhood houses the ETF’s 50-day and 200-day moving averages, which are on the verge of a “golden cross” (typically viewed as an indicator for upside price momentum), after making a “death cross” (typically viewed as an ominous technical indicator) in early October.
The last time these trendlines made a golden cross was in late April, coinciding with the transport fund’s all-time acme. Beneath that, the $181-$182 area represents a 50% Fibonacci retracement of the aforementioned high and low, and a 10% year-to-date gain for IYT.
It’s also where the shares were trading prior to an Oct. 11 bull gap. And if those levels don’t contain a steeper pullback for the ETF, there’s always the relatively reliable $175 price point, which has rather neatly contained retreats in 2019, and represents a 38.2% Fibonacci retracement.
In conclusion, recent history suggests IYT could rally back in November. In fact, another 4.72% bounce from last Friday’s close would put the ETF above $201.
However, in order to do that, the shares would need to take out a few familiar roadblocks. Should the transportation fund resume its recent retreat, though, downside could be limited, as it has been so far in 2019.


