Back in 2008, I wrote an article on the weeklies called “Weak Weekly Options,” in which I pointed out what little interest the weekly options had generated in the USA since their inception. I had also expressed the hope that "someday," things might change. The day of that change came on Friday, June 4, 2010, the same day the Dow tanked 323.33, or 3.15%, while all the major indices followed the Dow even to a greater extent. The Nasdaq was down 3.64%, and the S&P 500 3.44%. On that day, the exchanges chose to list weekly options on those three issues as well as the Russell 2000 Index. Below is a visual aid showing the major indexes the day of the addition of these weeklies.
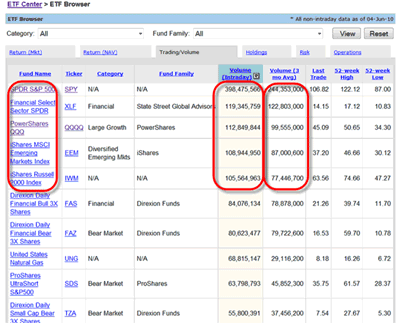
The figure above shows the most liquid ETFs on Friday, June 4, 2010. The first on the list is SPY, which has a three-month average daily volume of over 244 million. Just on that day alone, SPY surpassed its usual volume by (398-244) 154 million. Second in line was XLF, or the SPDR Financial Sector ETF. Unlike SPY, which had easily surpassed its average volume, the XLF on that day traded only 119 million, while its three-month average is three million higher, 122 million. What this tells us, as traders, is that the XLF did not suffer from panic selling. Third in line on that day was the QQQQ, which did just as SPY did and easily surpassed its three-month average of 99 million shares traded per day by an additional 13 million shares, bringing it to 112 million. Notice that the fourth in line is the EEM, or iShares MSCI Emerging Markets Index, which also easily surpassed its three-month average. The fifth most-traded ETF of that Friday was the IWM. By the way, the Dow's ETF is further down the list, but my point is that the XLF and EEM did not get weekly options listed on them this time around. If anyone would be on the list for the next round, it is most likely those two, the XLF and the EEM.
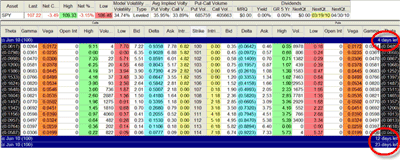
On that fateful morning of June 4, weekly options were listed on all four major index tracking ETFs (exchange traded funds). These four ETFs are the DIA (SPDR Dow Jones Industrial Average), the SPY (SPDR S&P 500), the QQQQ (PowerShares exchange traded fund), and the IWM (iShares Trust Russell 2000 Index). Although I was excited about their creation, I am certain that these new listings might have confused some traders. On the platform's option chain on that day, there were three kinds of June options listed. The first ones, with the least amount of days to expiry, were the weeklies.
Article Continues on Page 2
|pagebreak|The second ones were the regular options that expire on the third Saturday, and the last ones were the June quarterly options that stop trading on the last day of June, which is June 30, 2010. Figure 2 below was taken on Monday, June 7, 2010, before the opening bell. At that point, the listing on the weekly options did not say five days left because the platform by default had already counted Monday as gone.
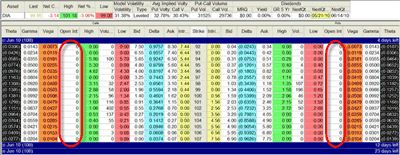
On this next figure of the DIA, I would like to focus on the reason why the open interest column is all zeroes. The option volume on the individual strike price is the volume that has gone through during the Friday session. The moment the market opened on Monday, those volume numbers were shifted to the open interest column.
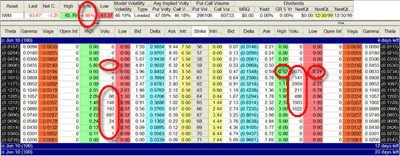
Figure 4 below displays the IWM action, which, by the way, has tanked more than any other index-tracking ETF. Please observe how the volume of call options traded that day is small versus the four or even five digits of put contracts; namely, the 60 puts volume was 10,075 contracts for that single day. The highest the 60 puts were was 0.62 cents, while the lowest price was 0.24 cents. Obviously, "someone" was doubling their investments by buying the 60 puts first for, let us estimate, 25 cents, and then later on selling them for 50 cents or more. The fact that this was done on the very first day of the weekly options being listed tells me that those "someones" are probably the big institutions.
Going back on the call side of the IWM, observe two things: The IWM closed at $63.77, while the majority of the call volume was on the OTM (out-of-the-money) calls with the strike price of 64, 65, and higher. Those experienced in option strategies know that those were likely bear calls that were being placed by the institutions. Keep in mind that in the case of a bear call involving, let us say, sold 66 calls and bought 67 calls, the intuitions that have traded them had to be correct only for one week. With the volatility that high, the premium on those options was quite rich, or juicy, as I like to call it.
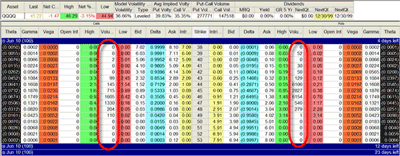
In this last figure below of the QQQQ, I would like to point out the same thing that I explained on the IWM: Volume. On the QQQQ, the volume of traded contracts of puts is so much greater than the calls, yet overall volume of both calls and puts on the QQQQ is so much greater than the IWM. Again, going back to the original point, on June 4, 2010, the most liquid ETF was the SPY, while the IWM held fifth place. The YahooFinance page, Figure 1, shows the liquidity of the underlying asset, but make no mistake about the options connected with it. These weekly options are a great tool if they are properly utilized for hedging, spread trading, or even directional intraday trading.
In conclusion, in this newsletter, I have brought to the attention of the readers the existence of new weekly options on very liquid ETFs. Unlike the previously existing weekly options listed on the XEO (European S&P 100) or OEX (American S&P 100) that are traded only by the CBOE (Chicago Board Options Exchange), these four new ETF weekly options trade on all option exchanges. These weekly options are here to stay. Get used to them and have green trading.
By Josip Causic, trader and instructor, Online Trading Academy

