By J.W. Jones of OptionsTradingSignals.com
The following strategy is a bit advanced, and beginner option traders will want to read this several times before implementing it. I would also recommend “paper trading” this strategy prior to trading real dollars in an account.
Let’s get started. IBM reported earnings after the closing bell on Tuesday, January 18. Let’s look back on how options could have been used to trade that news. For traders maintaining a position in common stock during earnings releases, the frequent price gyrations can result in uncomfortable moments. A strategy called a “double calendar spread” can help smooth out those ups and downs in your account.
Earnings releases for the options trader do not force us to take a position in which we must correctly predict the direction of price action stemming from the earnings release. By exploiting the typical changes in option pricing that reliably and reproducibly occur as the earnings announcement approaches, it is possible to establish a broad potential range of profitability that extends for a considerable distance both above and below the current price of the underlying.
The core point of understanding is to recognize that implied volatility (IV) increases in the series of options that will expire after the impact of earnings has been reflected in the price of the stock. Using the standard option pricing models, IV is directly correlated with option prices being “rich” or “lean.” In the specific case under consideration, IBM monthly options will expire this Friday, January 21. A further predictable characteristic of this IV increase is that this juiced IV will drop substantially and rapidly following the release of the earnings and the reaction of price of the stock to this event.
Armed with this knowledge of the characteristic behavior of IV, let us consider a trade to exploit this predicted sequence of events. The trade structure we will use is that of the “double calendar spread.” This spread is established by selling the front-month options with the juiced IV and buying longer-dated options with lower IV. The fundamental rationale for this trade is that we are going to sell “rich” option premium and buy normally priced premium.
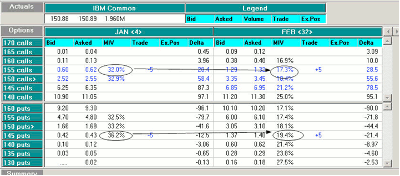
As a first step, consider this option pricing matrix for IBM the day prior to the announcement (IV is labeled MIV in this proprietary software):
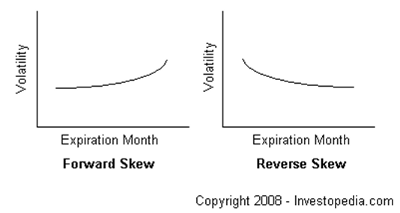
As highlighted by the ellipses and horizontal arrows, it is clear that the predicted increase in IV had occurred and there was a “horizontal volatility skew.” Horizontal skew refers to the situation where at a given strike price, IV will either increase or decrease as the expiration month moves forward into the future. A forward horizontal skew occurs when volatilities increase from near to far months. A reverse horizontal skew occurs when volatilities decrease from near to far months.
Intuitively, you would think that volatility increases as the expiration moves into the future because of increased uncertainty, and most options do. However, reverse horizontal skew can and often does occur during news events such as earnings announcements. In cases such as these, many options will actually trade with a combination of forward and reverse skew similar to that of the vertical skew's volatility smile. This is because options that expire far in the future will always tend to trade with higher IVs than shorter-term options, regardless of events happening in the near term.
MORE: The Next Step in Analyzing This Trade
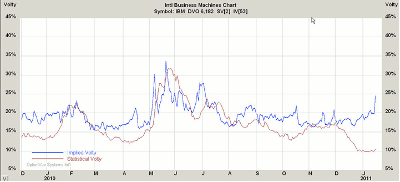
|pagebreak|The next step in understanding this trade is to check to be sure the historic range of volatilities that are typical for this underlying. Below is an embedded daily chart of the implied volatility. When considered together with the first chart of current pricing, it is clear that we are selling rich premium and buying more normally priced premium.
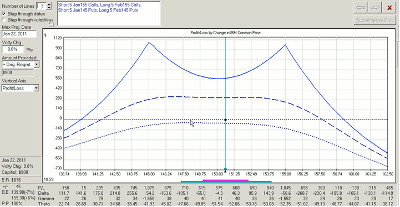
With this understanding, we can now consider the performance graph of this double calendar trade. It is constructed with four individual legs, which are executed by buying two individual calendar spreads. It should not be executed in four individual trades. The specific trades are to sell the January 155 calls, buy the February 155 calls, sell the January 145 puts, and buy the February 155 puts. The expected performance graph is embedded below:
As can be seen from the graph, the trade has breakeven points of 139.98 to 159.30. The magnitude of the predicted move can be gauged from the price of the at-the-money option straddle. That analysis gives a range of 145.90 to 154.10, price values well within the profitable zone of the trade.
What are our points of risk on the trade? Risk comes from two sources in a trade such as this: Price and IV. If price exceeds our breakeven points, the trade will be unsuccessful. If IV of the long legs collapses more than projected, the trade will produce losses. Risk is crisply limited to the amount paid for the trade; you cannot lose more than the capital invested.
This is an example of a controlled risk trade seeking to capitalize on well-recognized relationships between an earnings release and option pricing. This is not a “gimme” trade, but represents a reasonable risk/reward situation. As with all trades, it is presented for educational purposes only and does not constitute a recommendation.
By J.W. Jones of OptionsTradingSignals.com


