Terri Stridsman of Schaeffer’s Research explains how active put trading on popular retailer GameStop (GME) could indicate a bullish sentiment shift toward the stock.
Options players devoted some bearish attention to GameStop (GME) early this week, as nearly 5,600 puts crossed the tape on Tuesday alone, which was double the equity’s average daily volume. Close to 5,400 of these puts were exchanged at the out-of-the-money January 2012 22.50 strike—the majority of them between the ask and bid prices, making it difficult to say with certainty whether they were bought or sold.
However, open interest on this option climbed by 4,903 contracts overnight, suggesting that the bulk of the volume at this strike consisted of newly opened positions. This strike now holds peak front-month put open interest of 7,013 contracts.
Despite this surge in put volume, calls have been the options of choice on GME. The Schaeffer’s put/call open interest ratio (SOIR) checks in at 0.32, meaning that calls more than tripled puts among options set to expire within three months. In fact, this ratio ranks lower than any other reading taken over the past year, indicating that short-term option players are more bullishly oriented toward the stock now than ever before.
What’s more, GME’s ten-day International Securities Exchange (ISE), Chicago Board Options Exchange (CBOE), and NASDAQ OMX PHLX (PHLX) call/put volume ratio stands at 4.61, confirming that calls bought to open have more than quadrupled puts during the past two weeks. This ratio ranks in the 86th percentile of its annual range, conveying that traders have been scooping up bullish options over bearish at a faster-than-usual clip.
However, short interest on the videogame retailer rose by 3.29% during the past two reporting periods, which could imply that short sellers are responsible for some of the recent call volume. Either way, these bearish bets account for a hefty 29.69% of GME’s float. It would take nearly eight days to buy back these shorted shares at the stock’s average daily trading volume.
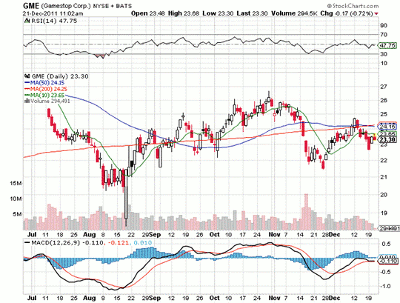
Technically, GME has gained almost 3% year-to-date, but it has underperformed the broader S&P 500 Index (SPX) by around 8% during the past 40 sessions.
Here is a recent daily chart:
On the charts, the stock is trading below its ten-day moving average, a trend line that has served as both resistance and support throughout the month.
By Terri Stridsman of Schaeffer’s Research


