Recent options data shows how a big institution likely went about executing a spread trade on the Powershares QQQ Trust (QQQ), putting over $1 million on the line in the process.
Recently, the market has been very volatile, and as I was teaching an options class in Philadelphia, Pennsylvania, we chose to look at the Powershares QQQ Trust (QQQ). This exchange traded fund that tracks the Nasdaq 100 index is one of the most liquid ETFs and this liquidity also reflects itself in the options volume and open interest.
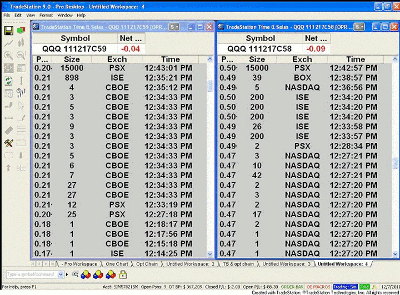
As I was explaining how to look up the option volume on TradeStation’s Time and Sales (T & S) window for individual option strikes, we noticed something extraordinary. Please refer to the figure below and before reading further, attempt to connect the dots.
The figure above is composed of two T & S windows, also known as the print, or the (ticker) tape. On the left is the 59 call option that trades until the third Friday of December 2011. On the right is the 58 call of the same class and cycle. Each of these options settled on Saturday, December 17, 2011, and that is reflected in the option symbol (111217C59).
The day on which we were viewing the T & S of these two calls is visible in the bottom right corner of the figure (12/7/11). What should be poking anyone’s eyes looking at the figure above is the size of a trade that went through around 12:43 pm EST. A single contract involves 100 shares, and 15,000 contracts would translate into 1,500,000 shares on each of these legs!
Knowing that both contracts were filled through the same exchange, we can assume that this was basically a spread trade involving the December 59/58 calls. Although there is no certainty which leg was bought or sold, we can know that there are two possible choices.
The first choice would be that the 58 call was bought and the 59 was sold, creating a vertical debit spread. The second choice would be the other way around: The 58 call was sold and the 59 was purchased. In order to be able to speculate further, we would need to know exactly where the QQQ was at the time.
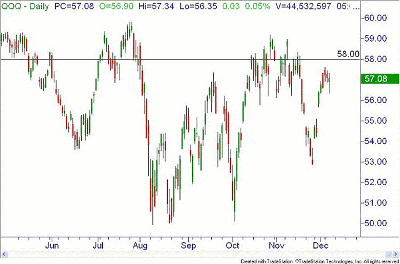
On Wednesday, December 7, 2011, QQQ closed at $57.08. If the first choice, a bull call spread, was done, it would mean that the 58 out-of-the-money (OTM) call was purchased for $0.50 and the 59 even more OTM call was sold for $0.20. The total debit for each contract would be $0.30 times 1,500,000, equaling nearly a half million dollars, or $450,000 to be exact.
In the case of a long vertical, no maintenance is used because all the money is paid up front. The question the reader should be asking is whether the big institutions that have most likely placed this "bet" would really buy something that is OTM with only a week of life remaining? Besides, technically, the chart does not support a bullish bet; the horizontal line drawn at 58 points out that the price action on December 7, 2011 was almost a whole point below.
|pagebreak|Let us move on to the second choice, a bear call spread involving the selling of the 58 for $0.50 and buying the 59 as a means of protection for $0.20. In such case, there would be maintenance of $0.70 per contract. The (59-58) spread is one point wide, and subtracting the credit of $0.30 leaves a maximum risk of $0.70.
Therefore, the institution has 1,500,000 times $0.70, or to be exact, $1,050,000 on the line, while the credit taken in was $0.30, or $450,000.
In terms of rate of return, it is (0.3/0.7) 42.8% and all that needs to happen is nothing. The QQQ does not have to go anywhere. In the first choice, the bull call, the QQQ would need to rally above the sold 59 call and close at or above it in order to be fully profitable.
In addition to that, buying debit spreads should be done when the implied volatility is low or in its lower range, while that was not the case here.
Having said that, I wish to show the evolution of the QQQ 58/59 bear call a few days later by first displaying the chart and then the option chain.
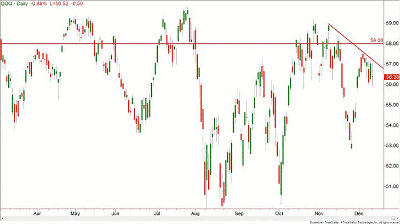
Figure 3 below is the daily chart of the QQQ taken on the close of Monday, December 12, 2011 when it closed at $56.38. Please observe that besides the horizontal line drawn at $58, a bearish diagonal line was drawn, pointing out that the QQQ was not able to trade above.
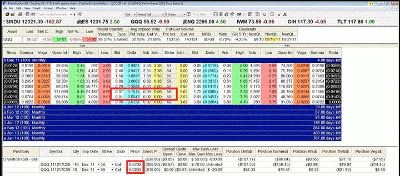
Next, let us move on to the option chain to see how much of the premium is left in the 58 and 59 options that expire in December’s third week.
The option analysis window of TradeStation displays both the option chain for December options as well as the (theoretical) spread trade right below it. For simplicity’s sake, ten contracts were used. Again, the 58 call, which was sold for $0.50, was showing a reading of only seven pennies, while the bought 59 call for $0.20 was trading at one-tenth of its value, or $0.02.
Let us go back to the original speculation. Had the institution purchased this big size involving over a million dollars of the firm’s capital, would they really buy that short-term option that has both legs that are OTM?
I leave my conclusion to the reader, because, in reality, everything depends ultimately on the observer. (The truth is in the eye of the beholder.)
The question is: where is the eye focused? On the TV that is marketing us the concept of buying OTM, or on the time and sales? Only you, the reader, know the correct answer for yourself. Stop being entertained; get educated. Read the print (tape/T & S) instead of watching the TV.
By Josip Causic, instructor, Online Trading Academy


