
Recent examples show how each week, traders can evaluate weekly option volume to gauge important clues about sentiment and create a sound short-term bias about the markets.
Thursdays are important for me as an options trader, and I tend to look at the volume of individual strike prices each Thursday morning. Every Thursday, the new weekly options are listed (with the exception once a month when the regular monthly options act as weeklies with only seven days left to expiry.) Based on the “dinosaur footprints” (institutional trades) I see, I create my short-term bias.
Let me lay down what exactly I am looking at and why.
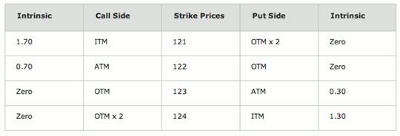
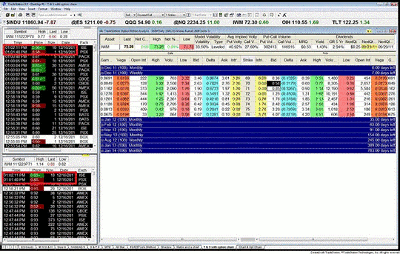
The table below is divided into two sections: calls and puts with various strike prices.
If the Spyder Trust (SPY) closed at $122.70 on Thursday, December 15, 2011—the day when the new weekly options were listed—then the calls have the following values, which are displayed in the second image below.
Click to Enlarge
This graphic below show the bid and ask prices for both calls and puts, as well as some additional values. For instance, the open Interest is zero, while the “volume today” is not zero.
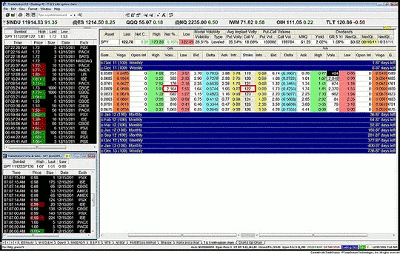
Click to Enlarge
Let us focus just on the “volume today” numbers that have four or more digits. On the call side, the 122 has a volume of 2,164, which is quite normal because most of the time, the highest option activity is seen in the at-the-money (ATM) options.
Please ignore all the three-digit volume today numbers and locate the additional strike with high volume. Which one is it, in the money (ITM), ATM, or out of the money (OTM)?
Next, let us look at the right side, the puts: where do you see the highest volume, in the money, at the money, or out of the money?
What is this information telling us? Having learned in the previous MoneyShow.com article that most likely the big institutions are "not just throwing darts," like Mr. Gordon Gekko would say, we could speculate that the big boys aren’t buying OTM options, but they are selling them.
However, checking only the SPY weeklies is not going to convince me to throw my money out just like that, so I need more evidence. I look at the option volume in the Powershares QQQ Trust (QQQ).
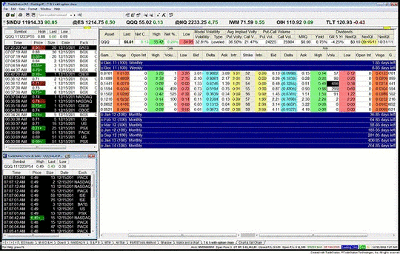
Click to Enlarge
A quick glance tells me that there is no unusual volume and no four digits on either side. However, that does not mean that checking the QQQ weekly options was a waste of time. Notice the pattern again: where did the majority of the contracts go off, ITM, ATM or OTM? I am not giving out the answers; everything is in the eye of the ultimate observer.
Now, let’s move on to the next candidate that has weekly options, the iShares Russell 2000 Index Fund (IWM). (By the way, the Diamonds Trust (DIA), which is the ETF that tracks the Dow, was skipped because it does not have weeklies.)
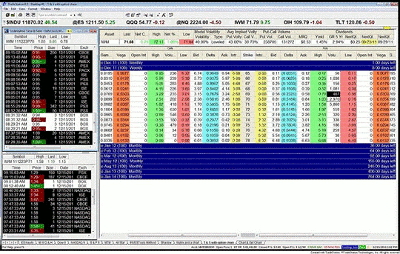
Click to Enlarge
The same approach is used: ignore all single, double, or even triple digits on volume today and focus solely on volumes with four digits. Starting with the call side, there is no call strike price that has huge, four-digit volume on the very first day of trading for the Christmas weekly options on Thursday, December 15, 2011.
Let us look at the put side. Do you see anything different? Again, no answers are given, but there is a hint. Right beside the option chain analysis window are two time and sales (T&S) windows. Look what is in them and attempt to decode what has happened using the lesson learned from this previous lesson.
The last figure I wish to share displays the activity in IWM on the close of Friday, December 16, 2011.
Click to Enlarge
The time and sales (T&S) windows actually show my trades on both legs. I always send in a “foot soldier,” or a single contract first, and then the rest of the troops (contracts) according to correct position sizing based on the max loss.
Most likely, the question going through readers’ minds is: "Why wait until the last minute to place the trade?" The answer is because when the market closes, it cannot go against me. Had I taken the trade on Thursday, I would have had a whole day (on Friday) for the market to go against me.
Again, these footprints should be looked at only as a tip and never as a sure thing. We all need to be accountable and responsible for our mouse clicking. We all need to do the due diligence, whether we are investing in real estate or options.
I do not jump on the weekly options on Thursday because I trade them with the credit spreads, and I wait until Friday to confirm my bias. Once the Friday option volume confirms it—like it did this time— then and only then will I no longer hesitate and pull the trigger.
In conclusion, recent option volume on the weeklies highlighted for me a bearish bias, and at least some of the trades taken by the institutions were bear calls. For the Christmas weekly options, as early as Thursday, December 15, 2011, the bias had shifted to bull puts.
The sample selected as the focus of this article was the sold 71 and bought 70 put spread on IWM. What the focus will be for this or any subsequent Thursday remains to be seen.
By Josip Causic, instructor, Online Trading Academy


