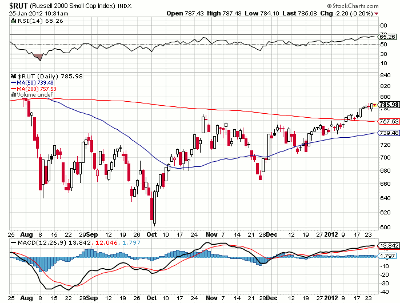
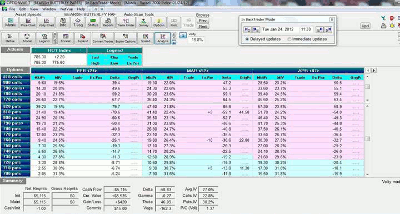
This trade example is based on real market conditions and shows how a well-capitalized trader or institution would execute and manage a bearish butterfly option position on the Russell 2000 index ($RUT).
On Friday, we initiated the March bearish butterfly option trade in the Russell 2000 Small Cap Index ($RUT).
If this was an actual live trade, you’d need to set aside about $25,000 in your account in order to leave some powder dry for adjustments that you may need to make if the market rallies in an extreme manner after the trade commences.
At the time that we initiated our hypothetical trade, the $RUT index was trading at 784.
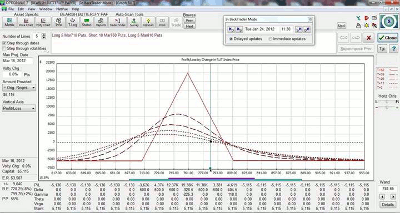
In accordance with our guidelines, we placed a five-lot put butterfly, centered at $RUT 760 below the market at a cost of $10.23 per lot. With that, our total initiation capital level is a little bit over $5,000.
Here is a profit and loss graphic for the trade:
As of yesterday morning, our position is up a little more than 1% of planned capital, but it’s been wobbling a bit.
This trade can be active for well over a month in some cases, and how the market plays out over time—and whether we react to it with discipline—is much more important than the positive or negative profit and loss (P&L) that will appear in the early days of the trade.
By John Locke, contributor, SMB Capital blog


