Fundamentals such as supply and demand work better in natural gas futures than they do in many other commodities and futures markets, according to options trader, Matt McKinney of Zaner Group. Here he offers some ways to play the current super-trend he sees in this market.
Although, natural gas futures are in a super-trend up according to my technical indicators, I would really like to see a new high close for the move.
Fundamentally, in an article on Bloomberg news titled, U.S. Winter Seen Harsher Than Last Year, Boosting Demand (10/18/12) I read that, "The coming U.S. winter will probably be cooler than a year ago, boosting demand for heating fuels such as natural gas, a panel of forecasters said. While December will be warmer than normal, temperatures will drop through February, increasing natural gas use by 13% percent over the same period from last year, Commodity Weather Group LLC president Matt Rogers said during a panel discussion at Earth Networks Inc.'s seventh annual energy weather seminar in New York yesterday." This article was very informative to me when it comes to demand for physical natural gas this coming winter.
In my opinion, normal fundamentals like supply and demand work much better in NYMEX natural gas futures than they do in many other commodities and futures markets so I like to pay attention to this. That same article read further that, "In the winter of 2011 to 2012, warmer-than-normal temperatures, particularly in the large cities of the U.S. Northeast and Midwest, crimped demand for heating fuel, sending natural gas futures to a 10-year low in April." In my opinion, this year if demand increases substantially, we could see NYMEX natural gas futures move even higher than they are today.
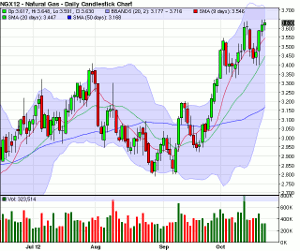
Daily NYMEX Natural Gas Chart
Based on the technicals that I use, which work on any market and any time frame although, nothing works 100% of the time, this natural gas market on this daily chart is in a super-trend up. On about September 12, the 9-day simple moving average (red line) made a cross over the 20-day simple moving average (green line) and that's when I began to watch the market closely, because the cross is the first component to the super-trend up. The next two components occurred on about September 27, which was when the two SMA's the 9 and the 20 started to point up on sharp angles and the market began to trade above the 9-day SMA. That is when the super-trend up began and it's been that way ever since using the 9-day SMA as support. Over the last week of trading, we saw the 20-day SMA become support and it worked. For example, on October 16, 17, and 18, the market fell below the 9-day SMA, went near the 20-day SMA, held support there, and then went back above the 9-day SMA into a super-trend up. I really want to see a new high close in this market and today (10-22-12) may be that day then we will be well on our way, in my view. Please understand this is just my opinion according to the technical indicators that I like to use, obviously there is no crystal ball.
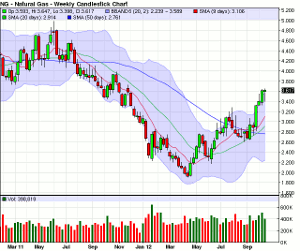
Weekly NYMEX Natural Gas Chart
Technically, in my opinion, we have a natural gas market on a weekly chart that has just began to show us a super-trend up. It works the same way as on the daily chart. We got the cross of the 9-period simple moving average (red line) crossing over the 20-period simple moving average (green line) on the week of June 11. Now until the week of September 12, we had a combination of a super-trend up and an upward trend in the natural gas market because the market went back and forth using the 9-period SMA as support (super-trend up) and the 20-period SMA as support (upward trend). This made it still a buy, but I like to recommend call options when super-trend up's are in full effect most of the time. This occurred on the week of September 24 when we had a breakout to the upside and the market started to trade well above the 9-period SMA. In my opinion we could be overbought here and due for a correction because the market is actually trading above the top line of the Bollinger Bands (blue shaded area), but it's also my opinion that markets can remain overbought for long periods of time, particularly if they have lots of momentum.
NEXT PAGE: Option plays on this super trend
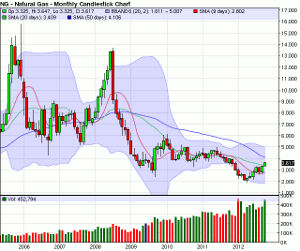
|pagebreak|Monthly NYMEX Natural Gas Chart
Technically, this monthly NYMEX natural gas chart has only two things that remotely excite me. It is the fact that after years and years of dragging along the bottom in a tight consolidated trading range, we finally see a slight change. The first is natural gas futures market on this monthly chart has bounced off of the support of the bottom Bollinger Band (blue shaded area). That happened in the month of April 2012. Secondly, it rallied all the way above both the 9-period simple moving average (red line) and then above the 20-period simple moving average (green line). The other slightly encouraging item is that the 9-period SMA is starting to curl up. Other than that it is a very lagging indicator and not nearly as relative to my options trading style as the daily and weekly charts.
Options Plays
Some potential plays could be to buy bull call spreads and/or outright calls in NYMEX natural gas, if we believe the trend is still going higher. I like to recommend to my clients to trade with the trend instead of trying to pick a "top" or a "bottom", but when buying calls or call spreads we also look to buy, in a 3 to 1 ratio, a put for protection in case the market makes a major move against us.
By Matt McKinney of Zaner Group


