Adam Warner, contributor to Schaeffers Investment Research, takes a look back in time to see if history can repeat itself.
As the world parses every little CBOE Market Volatility Index (VIX) tick so precisely, what do you say we look back on a week not that long ago when we did see some slightly more noteworthy action?
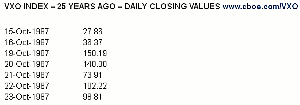
Twenty-five years ago, on October 19, 1987, the S&P 500 Index (SPX) fell by 20.5%, and the CBOE S&P 100 Volatility Index (VXO) rose by 313% to close at 150.19.
Below are key values for seven trading days in October 1987
OK, I guess it was pretty long ago. But pretty amazing range, no?
Now, I know what some of you are thinking. The VIX didn’t exist in 1987. Neither did Twitter or Google (GOOG) or NFL Red Zone for that matter (we did have electricity, though). When the CBOE started "printing" VIX in 1993, they backdated data to 1986.
How'd they do that? Well, VIX is simply a calculation based on the implied volatility of index options quotes. The pre-2004 VIX used OEX options and considered only near-money strike prices. The methodology changed in 2004, to its current form (SPX options and a much wider array of strike prices), but CBOE continues to calculate the "old" way under the symbol VXO. Thus, "old" VIX data is under the VXO symbol.
It's not exactly apples to apples, but it's close enough. SPX options were not active enough in 1987 to get reliable data using the current methodology, though I suppose you could use the current VIX methodology on the 1987 OEX board to tweak the numbers. But that wouldn’t be a very productive use of time; there’s not much difference between a VIX shooting to 140 than there is to 150.
The question is always whether it can happen again.
Well, the VIX has certainly gotten a bit overbought last week. I use "20% above its 10-day simple moving average" as a loose proxy, and it hit that mark at about 10:30 am ET Tuesday (it also busted through the upper Bollinger Band, if you prefer). I permanently view VIX as a mean-reverting instrument, so when it stretches about that far from its mean as I define it, I begin to look for reversion. In English, I am looking for an end to the sell-off soon—especially so now, when this VIX pop and market drop are essentially countertrend moves within longer-term trends lower in VIX and higher in the market.
But, of course, we have outliers. The VIX exploded last fall and peaked over 70% above its 10-day simple moving average. That’s the low-probability event, but obviously not an impossible one.
That doesn’t get us anywhere near 150, though. Or even 50. That’s more like high 20s. And it sounds silly saying this in a post that references 1987, but high 20s in the near future is a very big move and would feel a bit like a crash, given the generally low-volatility backdrop we began with.
So, yes, anything’s possible, but VIX in the 100s is very, very, very unlikely.
Disclaimer: The views represented on this blog are those of the individual author's only, and do not necessarily represent the views of Schaeffer's Investment Research.
By Adam Warner, Contributor, Schaeffers Investment Research


